Reliability Maturity Assessment + Playbook

Find out if your facility is one failure away from a full stop.

Take the 2-minute Reliability Maturity Assessment and get the Uptime Preservation Playbook — the continuous condition monitoring framework reliability leaders use to close detection gaps in high-throughput operations.

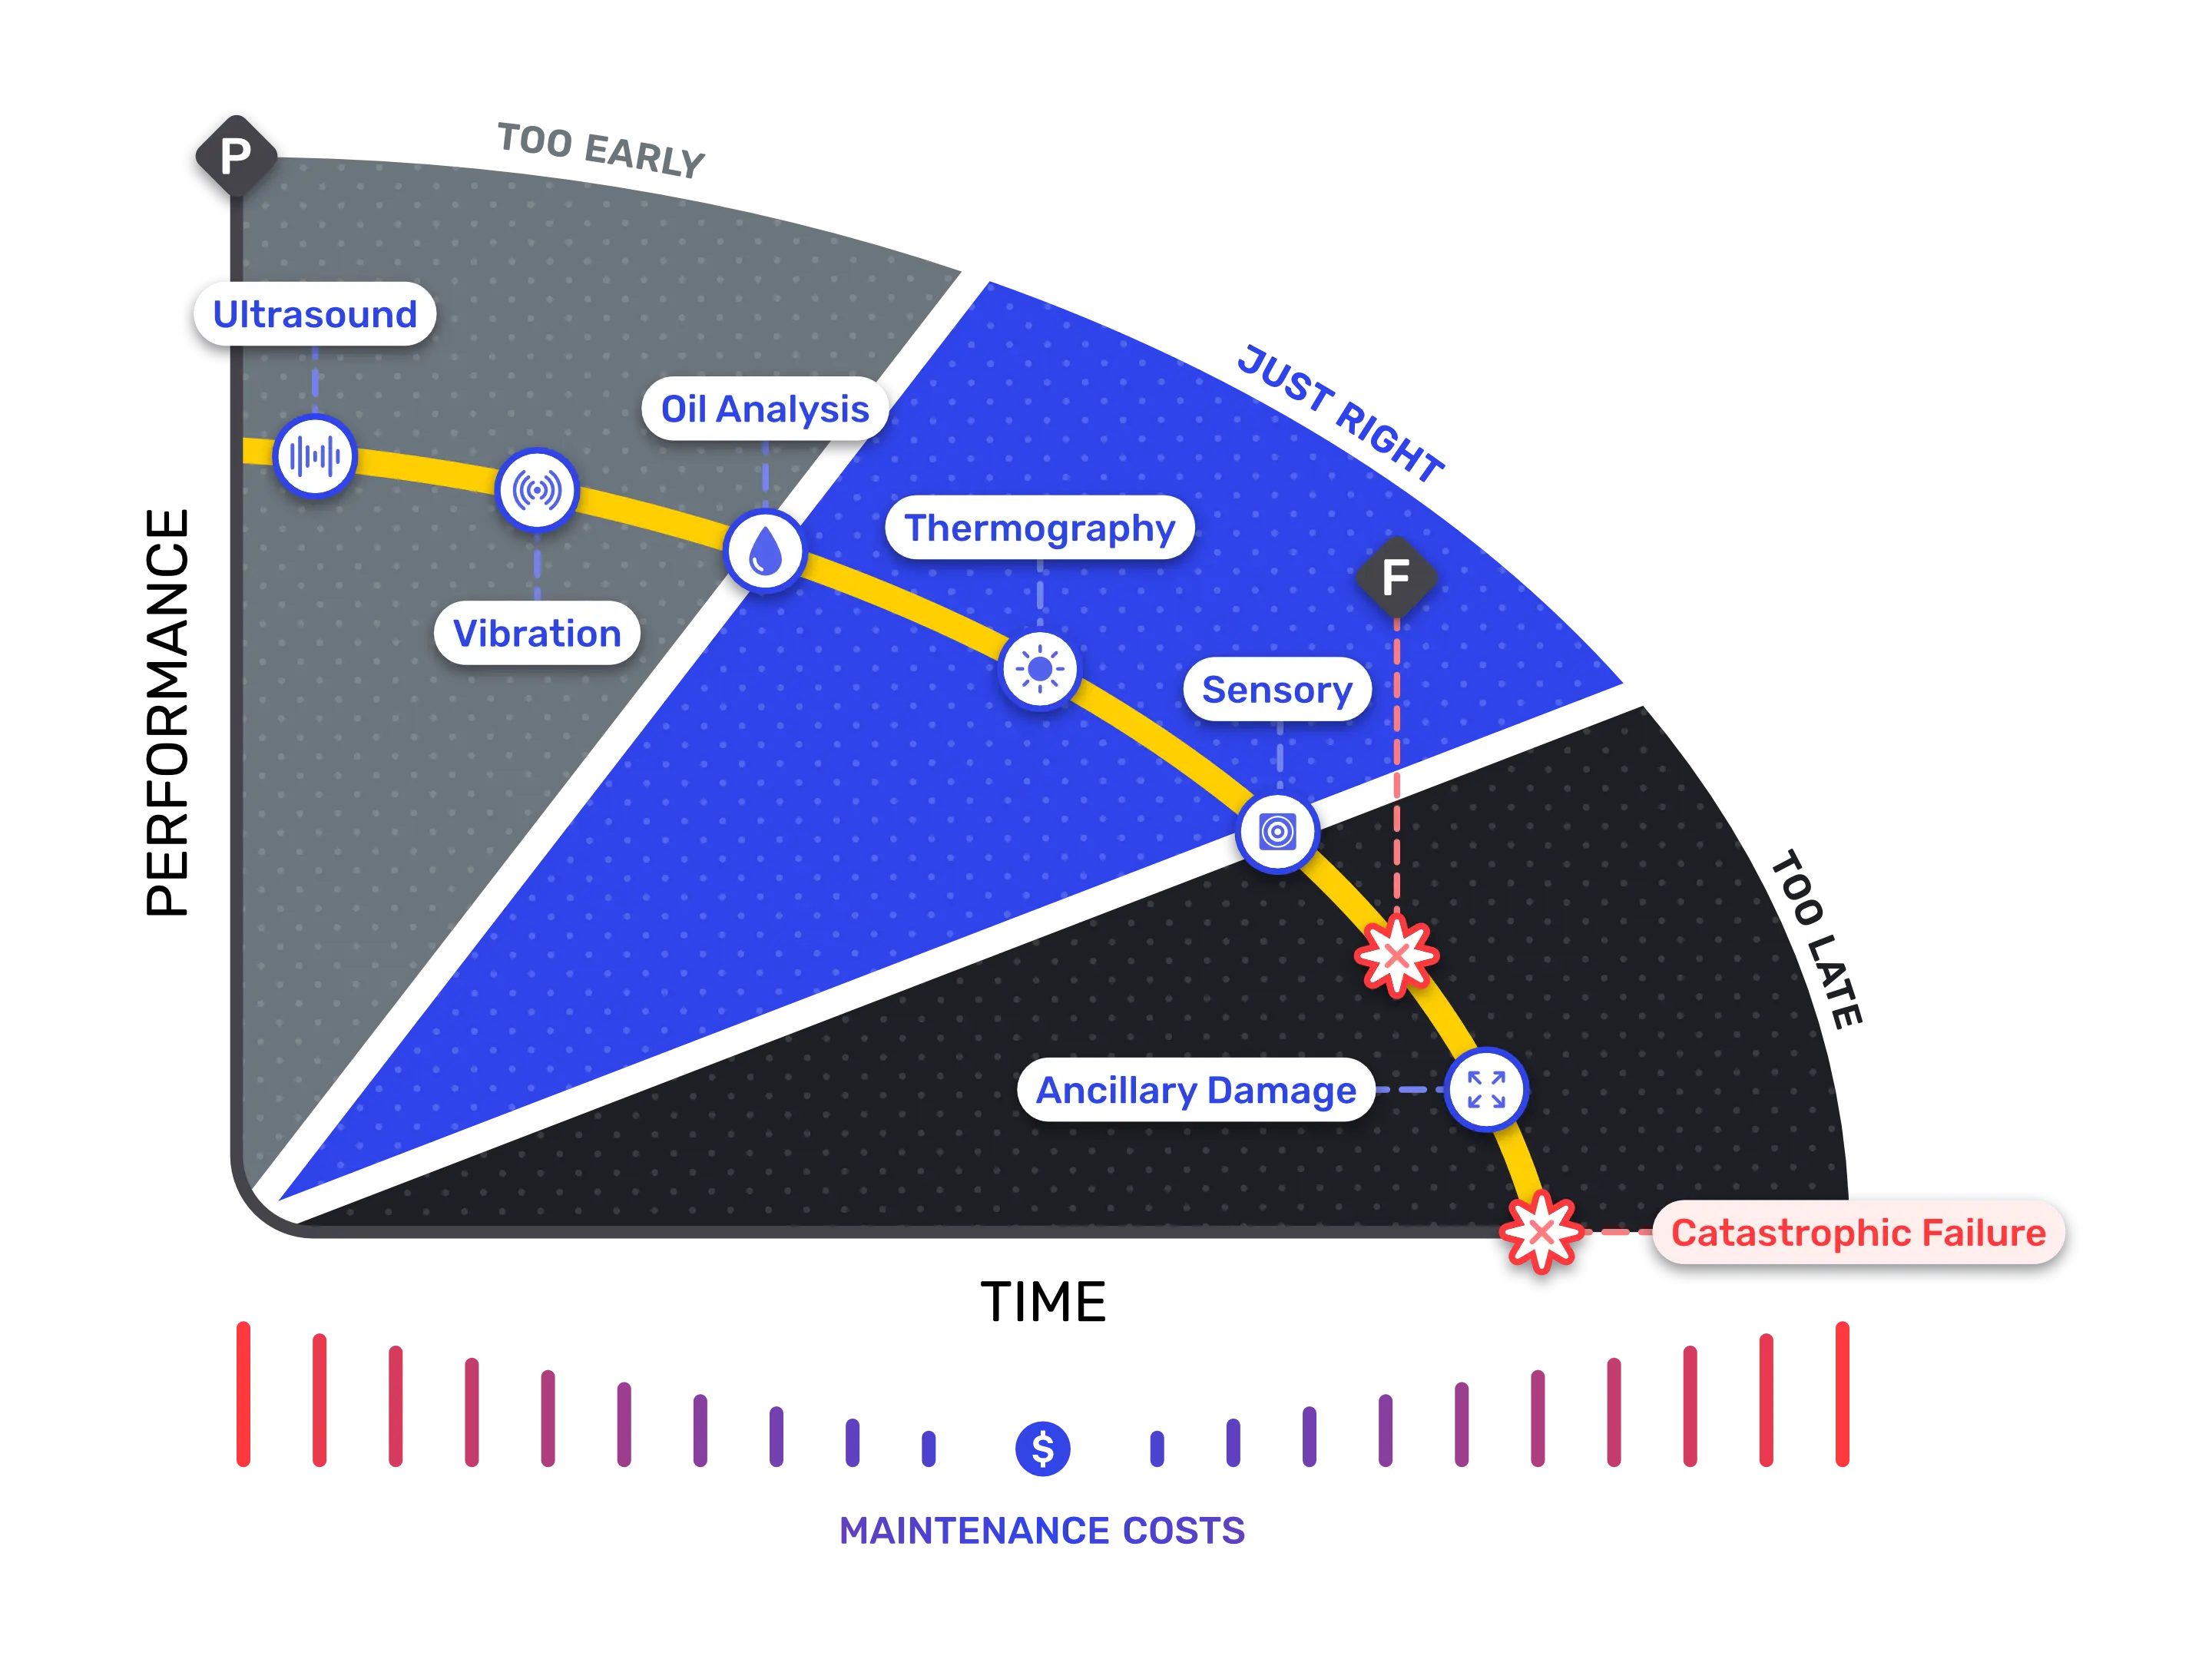
  • The P-F curve framework for sizing your detection window
  • The Detection-Impact Matrix for prioritizing assets that matter
  • A 6-stage deployment roadmap with success metrics
  • Real-world scenario: how the same sorter failure plays out with and without continuous monitoring

Built for reliability, engineering, and operations leaders in distribution, parcel, cold storage, and airport operations.

Get the Playbook

Delivered to your inbox. No commitment.

Used by reliability teams at leading distribution and logistics operators

  • manchester airport group
  • ford logo
  • BUNGE
  • CMC
  • KINDER MORGAN
  • INDUSTRYNET
  • Hostess
  • Ochsner
  • pactiv evergreen
  • Sunopta
  • SEABOARD CORPORATION
The Problem

In automated facilities, one asset failure stops everything.

Modern automation in high-throughput facilities — distribution centers, parcel hubs, baggage operations — increases uptime risk because it increases asset interdependence. When a critical conveyor, sorter, or control cabinet goes down, upstream lines block, downstream teams run out of work, and service commitments are immediately at risk.

Inside a tightly-timed or 24/7 operation, lost uptime usually means lost output, not delayed output. The question is no longer whether you can fix it. It's whether you saw it coming.

Upstream blockage

Product keeps feeding into the failure point, but can't move down the line.

Downstream stoppage

Sortation, loading, and handling teams run out of work the moment the line stops.

Irrecoverable loss

In 24/7 environments, lost uptime is lost output — not delayed output. Throughput doesn't come back.

2-Minute Self-Assessment

The Reliability Maturity Scorecard

Three questions. Two minutes. Find out whether your current monitoring approach gives you enough time to plan an intervention — or only tells you operations are already grinding to a halt.

The Framework

The P-F curve: how to size your detection window.

The goal of continuous condition monitoring is not to detect degradation as early as possible. It's to reduce detection latency — the gap between the first detectable sign of degradation and the moment your team becomes aware of it — so the operation has time to plan ahead.

The P-F curve is a practical way to judge whether your current maintenance approach gives you enough time to act before failure affects operations:

P — Potential Failure: the point at which a degradation signal first becomes detectable.

F — Functional Failure: the point at which the asset can no longer perform its intended function.

P-F Interval: the usable window between the two — the time you have to plan, schedule, and resolve before operations are affected.

Different detection methods sit at different points on the curve. Periodic inspections often surface issues too late. Single-sensor systems often surface them too early to be actionable. Continuous multi-sensor monitoring targets the actionable middle.

img-114
The Model

The Detection-Impact Matrix: where to start.

Not every asset deserves continuous monitoring. The highest ROI comes from assets with the largest operational blast radius and the longest detection gaps. Rank candidates against two axes — operational impact and detection latency — and prioritize accordingly.

Top Priority
Must Monitor

High operational impact, high detection latency. Long visibility gaps on assets whose failure stops the building. First candidates for continuous monitoring.

Second Wave
Should Monitor

High operational impact, lower detection latency. Quarterly inspections aren't enough — the consequence is too high to risk.

Optional
Could Monitor

Low operational impact, long detection gaps. Additional visibility helps but the ROI case is weaker.

Run to Failure
Ignore

Low operational impact, inexpensive to replace. Run to failure makes economic sense.

High-ROI Zones

The five asset classes where continuous monitoring pays back fastest.

Across high-throughput operations, the same five asset classes consistently show up as Must Monitor candidates — high consequence, often enclosed, and difficult to assess through periodic inspection alone.

Electrical Infrastructure

Thermal overload, fuse and housing corrosion, distribution failure. A single fault can drop power across multiple lines simultaneously.

Drive Systems & VFDs

Overheating, synchronization loss, bearing degradation. Failures disrupt both motion and control, escalating component damage downstream.

Control Cabinets

Heat-driven electronic stress, communication failure, hidden deterioration. Enclosed assets often fail invisibly until the wider system is already affected.

Automation Controls

Logic interruption, communication gaps, software-driven latency. These sit at the coordination layer, so failures create outsized disruption.

Critical Conveyors & Sortation Systems

Belt tracking friction, bearing degradation, mechanical jams. These are the primary arteries of the building — a simple component issue becomes a system-wide event.

The Roadmap

The 6-stage deployment plan.

Continuous monitoring fails when it's deployed everywhere at once. Start with the assets whose failure does the most damage. Expand from evidence.

step
Map Operational Bottlenecks

Walk the line while it's running. Identify every point where a failure would create idle time upstream and downstream — don't rely on layouts or OEM docs.

step
Identify Critical Assets (SPOFs)

Single-point-of-failure assets are those whose failure materially interrupts throughput or availability. Rank by operational criticality — not replacement cost.

step
Assess Current Detection Methods

Document how SPOF assets are monitored today and estimate the P-F interval for each failure mode. This is where most teams find their strategy doesn't match the actual failure timeline.

step
Set Success Metrics

Define what success looks like before launch: fewer reactive events, more repairs moved into planned windows, fewer unnecessary manual checks, less idle labor during outages.

step
Deploy Where It Matters Most

Launch on Must Monitor assets first. Expand to Should Monitor once the operational case is validated.

step
Expand Coverage Over Time

Scale across assets, lines, and sites based on evidence — prioritizing highest throughput, highest cost of downtime, and most severe choke points.

Real-World Scenario

The same sorter bearing failure, two different outcomes.

A bearing on a primary shipping sorter begins to wear. Lubrication breaks down, friction rises, heat builds. Here's how the same failure unfolds with and without continuous monitoring.

  Without Continuous Monitoring With Continuous Monitoring
How the issue surfaces Surfaces when the system trips and the sorter is forced offline. Surfaces while the asset is still functional — degradation visible early enough to validate and plan.
Operational impact Product backs up at the feed. Upstream zones can't clear. Downstream teams lose work. Operation continues running while maintenance plans the intervention.
Maintenance posture Crisis mode. Live outage. Time pressure. Planned mode. Confirmed issue, labor lined up, parts staged.
Labor effect Shift stands around. Maintenance diverted into emergency response. Technicians go directly to the issue. Labor stays focused.
Damage exposure Friction and misalignment damage adjacent rollers, belts, and frame. Damage contained to the original part. No wider mechanical spread.
Business outcome Missed throughput, idle labor, emergency repair, SLA exposure. Planned intervention, protected uptime, controlled cost.
Avoid These

The roadblocks that derail continuous monitoring rollouts.

Most failed deployments aren't technical failures. They're organizational ones.

Roadblock How to Avoid It
Trying to monitor everything at once Use the Detection-Impact Matrix. Start with Must Monitor assets. Expand from evidence.
Weak workflow integration Design workflows before deployment. Define who verifies alerts, who decides action, who schedules the work.
Low cross-functional buy-in Treat operations, engineering, and maintenance adoption as part of the deployment — not a post-rollout problem.
Late IT and security involvement Bring IT and data security into planning, not rollout. Address connectivity and data security upfront.
Team change resistance Build change management into the pilot. Address fear of replacement with clear communication early.
Pilots without success metrics Define success before launch. Measure reactive event reduction, planned vs. emergency repair ratio, labor allocation.
faq

Common questions about reliability maturity and continuous monitoring.

What is a reliability maturity assessment?

A reliability maturity assessment evaluates how well your current monitoring and maintenance strategy can detect asset degradation early enough to plan an intervention. It surfaces where you sit on the spectrum from reactive maintenance to continuous condition-based detection.

What is the P-F curve in condition monitoring?

The P-F curve maps the interval between Potential Failure (P) — the first detectable sign of degradation — and Functional Failure (F), when the asset can no longer perform. The usable window between the two determines whether your maintenance approach gives teams enough time to act before operations are affected.

How is continuous condition monitoring different from predictive maintenance?

Continuous condition monitoring detects current asset degradation in real time using fixed-mount multi-sensor inputs. Predictive maintenance attempts to forecast remaining useful life from historical patterns. MSAI focuses on early degradation detection — the actionable signal, not the forecast.

Does continuous monitoring replace maintenance technicians?

No. Continuous monitoring moves skilled technicians off routine inspection routes and onto targeted action on assets that are actually flagging risk. It makes existing teams more effective, not redundant.

Does MSAI replace our CMMS, SCADA, or BMS?

No. MSAI is an intelligence layer that operates above existing systems. It complements your CMMS, SCADA, BMS, and PLC infrastructure with continuous condition visibility — it does not replace any of them.

Which assets benefit most from continuous condition monitoring?

The highest-ROI candidates are single-point-of-failure assets with high operational blast radius: electrical infrastructure, drive systems and VFDs, control cabinets, automation controls, and critical conveyors or sortation systems.

What is detection latency?

Detection latency is the time gap between the first detectable sign of asset degradation and the moment the operations team becomes aware of the issue. Long detection latency turns manageable degradation into an emergency. Reducing detection latency is the operational goal of continuous condition monitoring.