Resources
Practical tools designed to advance your condition intelligence strategy.
Featured Resource
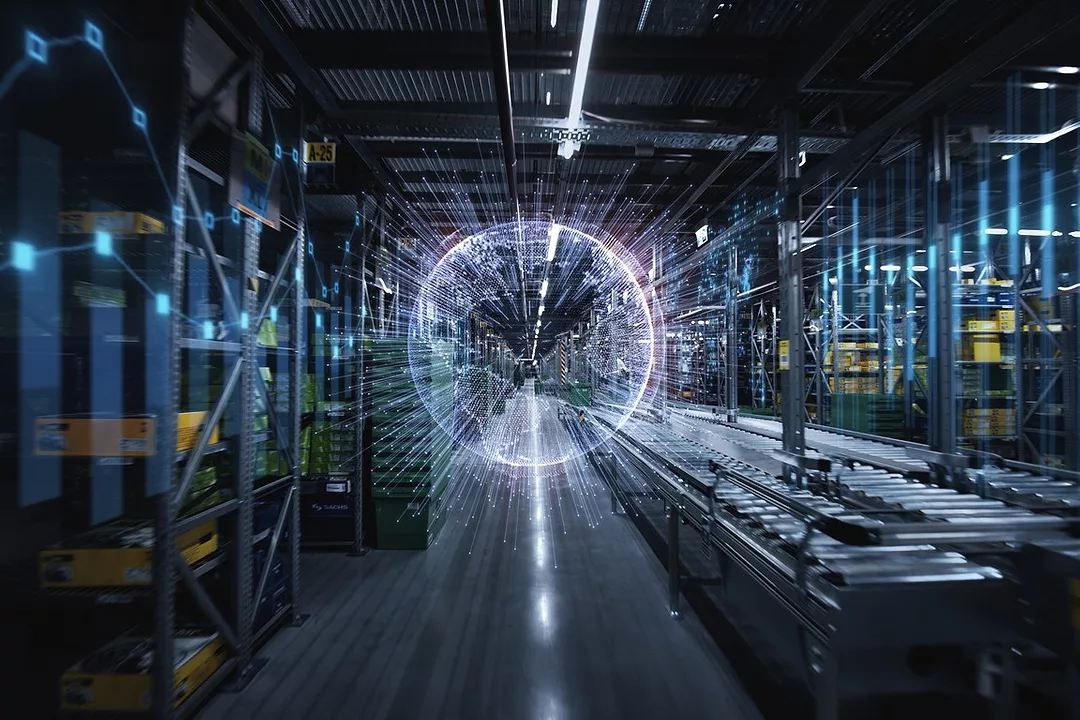
The Visibility Gap Inside Smart Warehouses
Investment in smart warehouses cannot stop at the automation layer itself. The condition monitoring strategies protecting those environments must evolve at the same pace as the ...
Resource Type
The Visibility Gap Inside Smart Warehouses
Investment in smart warehouses cannot stop at the automation layer itself. The condition monitoring strategies protecting those environments must evolve at the same pace as the ...
.png)
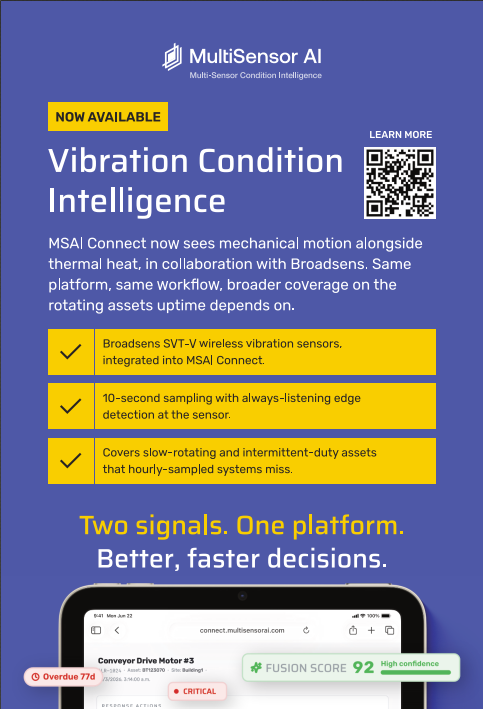
MSAI Connect for Vibration Analysis
Mechanical degradation in rotating equipment is often difficult to detect until vibration levels escalate into functional failures, unplanned downtime, or costly maintenance ...

AI Workloads Compressing Data Center Failure Timelines
Rising AI workloads are straining data centers, with rack densities jumping from ~20 kW to over 100 kW and infrastructure running closer to its limits continuously. Traditional ...

MSAI Connect for Electrical Fault Detection
Electrical faults rarely begin with catastrophic failure — they start as subtle thermal imbalance, overloaded circuits, loose terminations, or resistance heating hidden inside ...

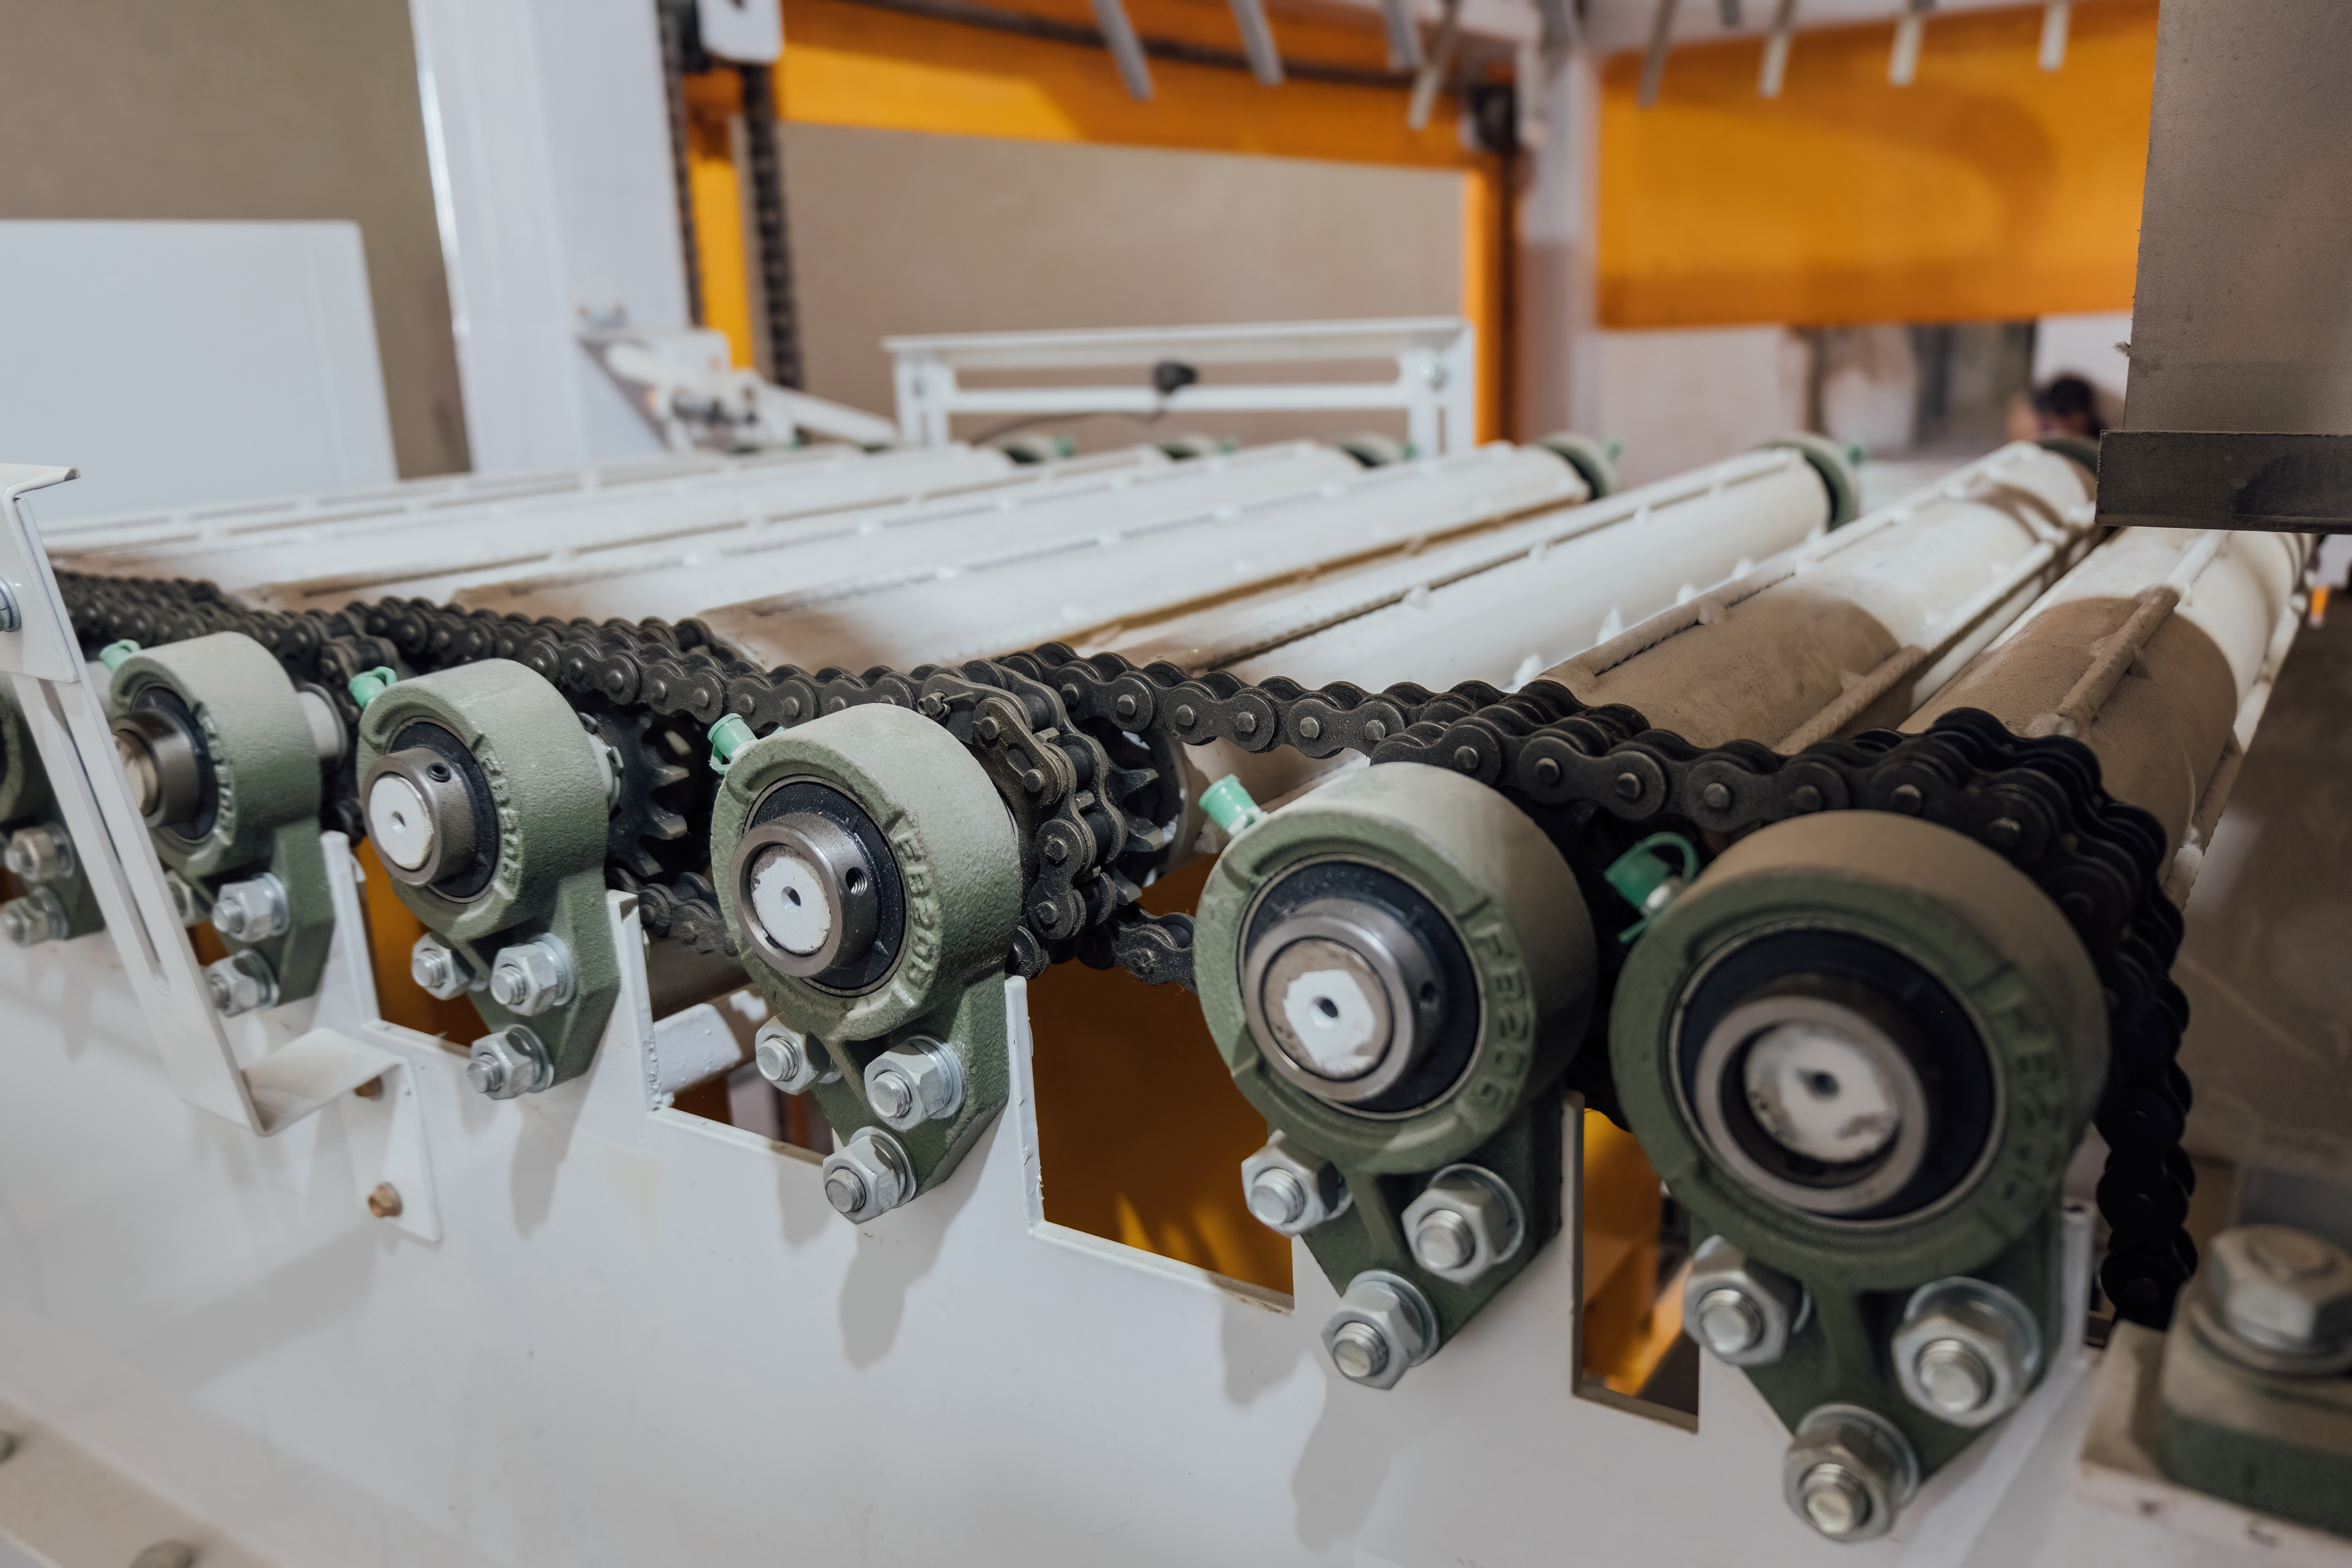
MSAI Connect for Rotating Equipment Degradation
Rotating assets such as motors, bearings, pumps, compressors, rollers, and conveyor drives often degrade progressively long before failure becomes visible to operations. MSAI ...
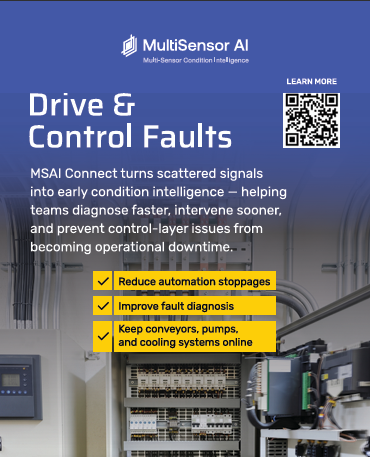
MSAI Connect for Drive & Control Faults
Modern automated operations depend on drives, PLCs, MCCs, VFDs, and control systems functioning continuously under demanding operating conditions. When degradation develops inside ...

MSAI Connect for Renewable Performance Loss
Performance degradation in renewable energy systems is often difficult to detect until output loss materially impacts operational efficiency and energy performance. MSAI Connect ...
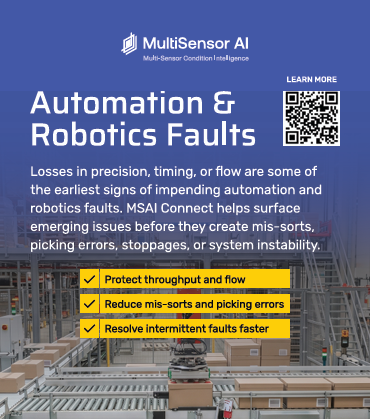
MSAI Connect for Automation & Robotics Faults
Highly automated environments rely on robotics, conveyors, sortation systems, and automated handling infrastructure operating in constant synchronization. Small mechanical or ...

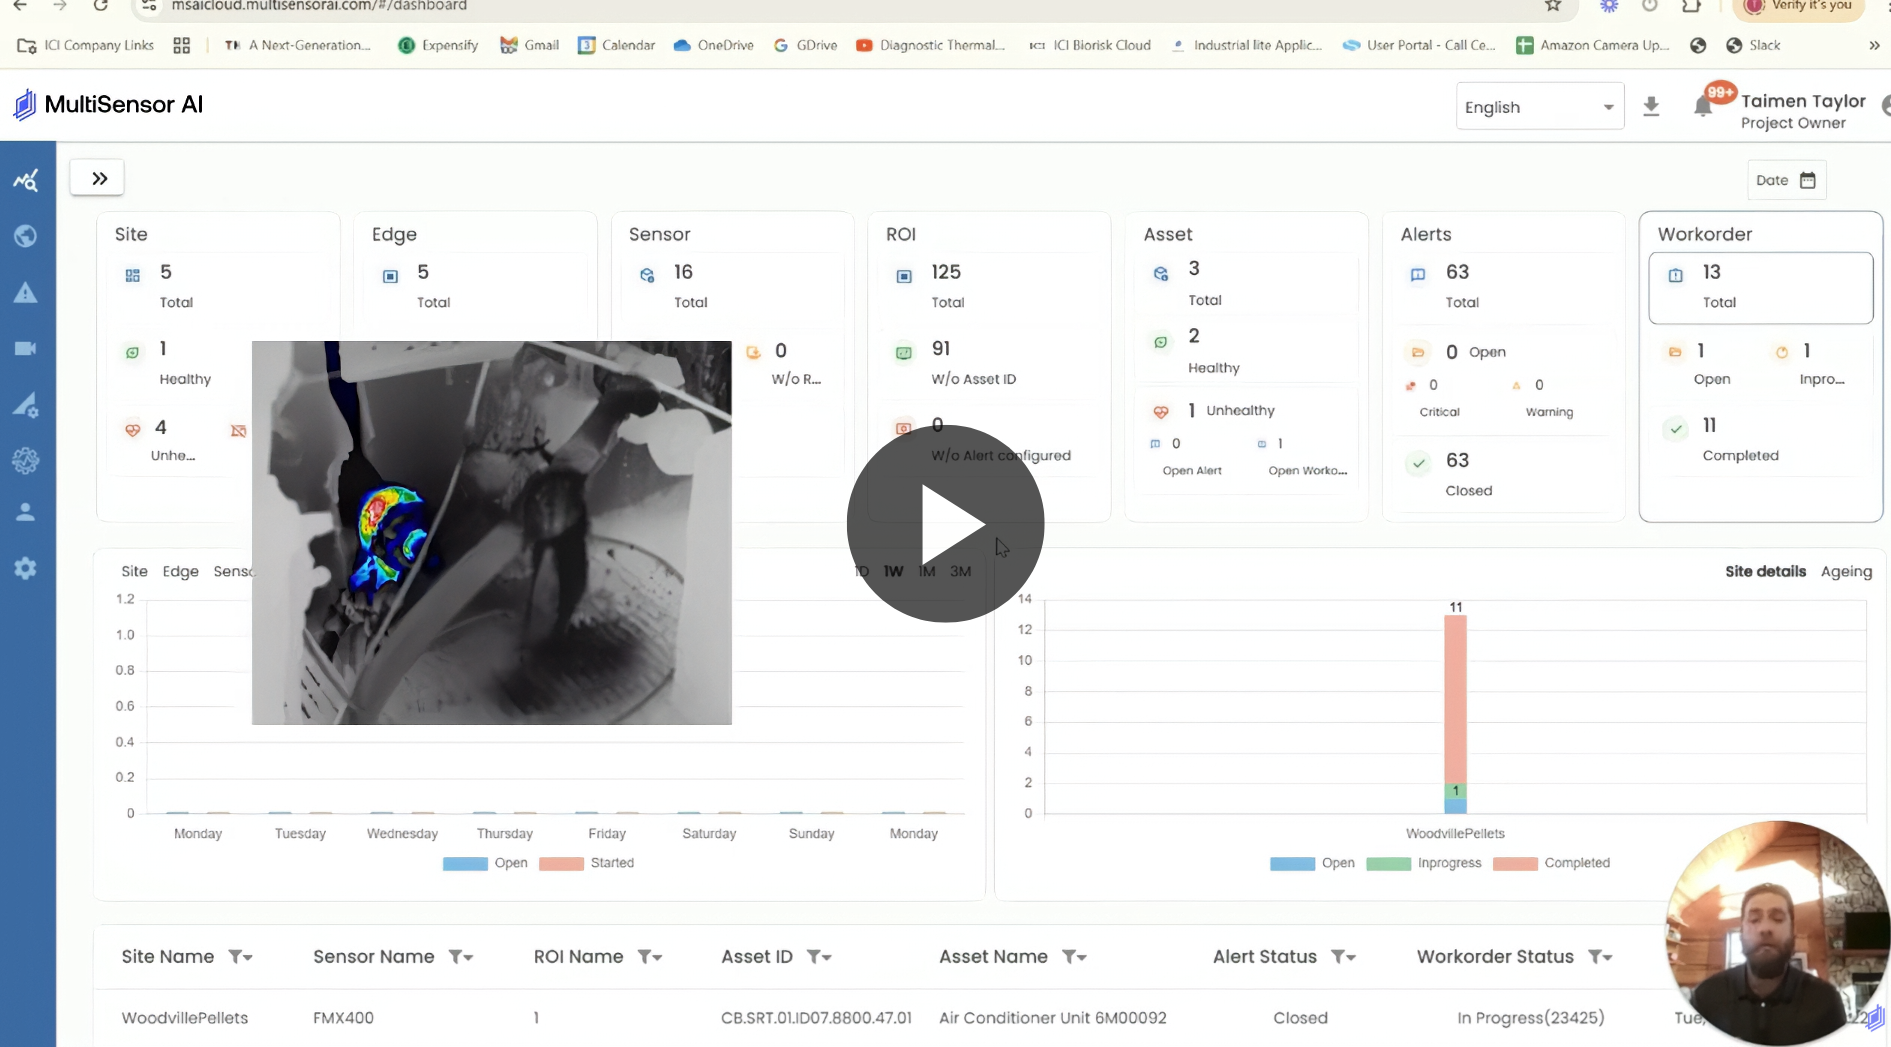
MSAI Connect for MSAI Connect Overview
MSAI Connect is a Multi-Sensor Condition Intelligence Platform designed for highly automated, uptime-critical environments where electrical, mechanical, and environmental failures ...
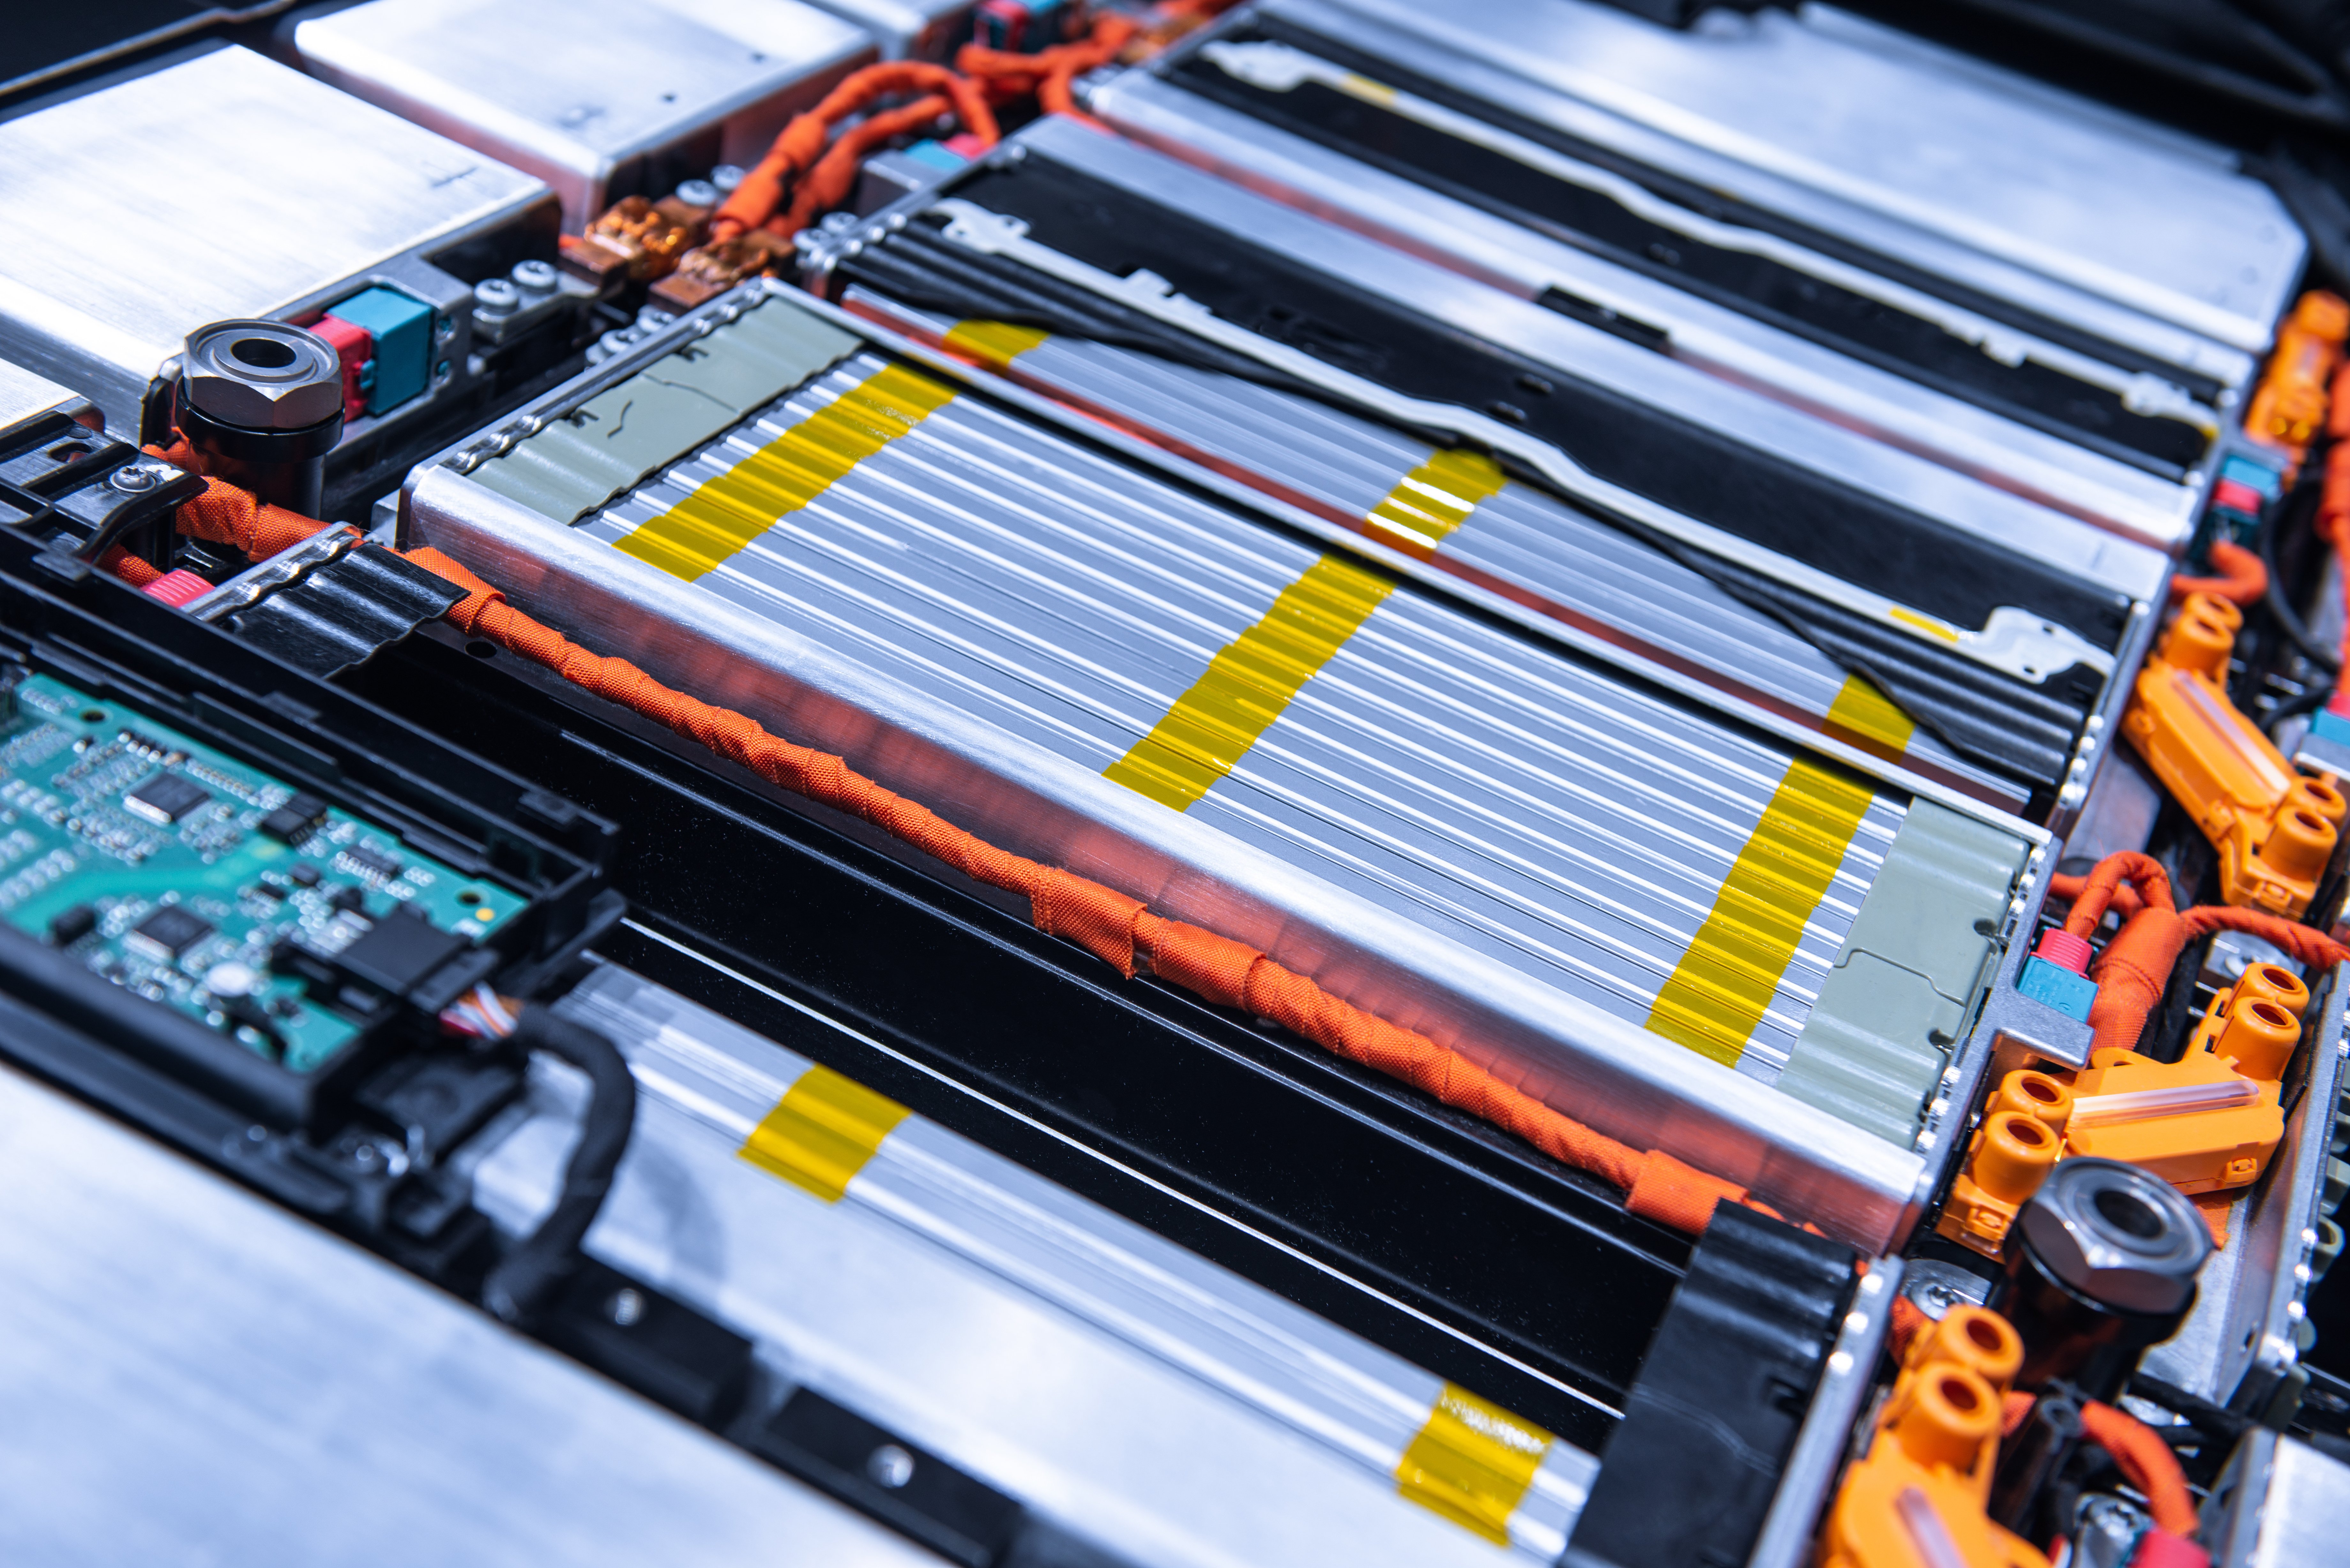
Early Fire Detection for EV Battery Protection
This one-pager outlines how MultiSensor AI protects EV battery production and storage facilities from catastrophic thermal events through continuous early fire detection. Using ...
Early Fire Detection for Industrial Applications
This one-pager outlines how MultiSensor AI helps industrial operators prevent catastrophic fires and protect critical assets through continuous early fire detection. Using fixed ...
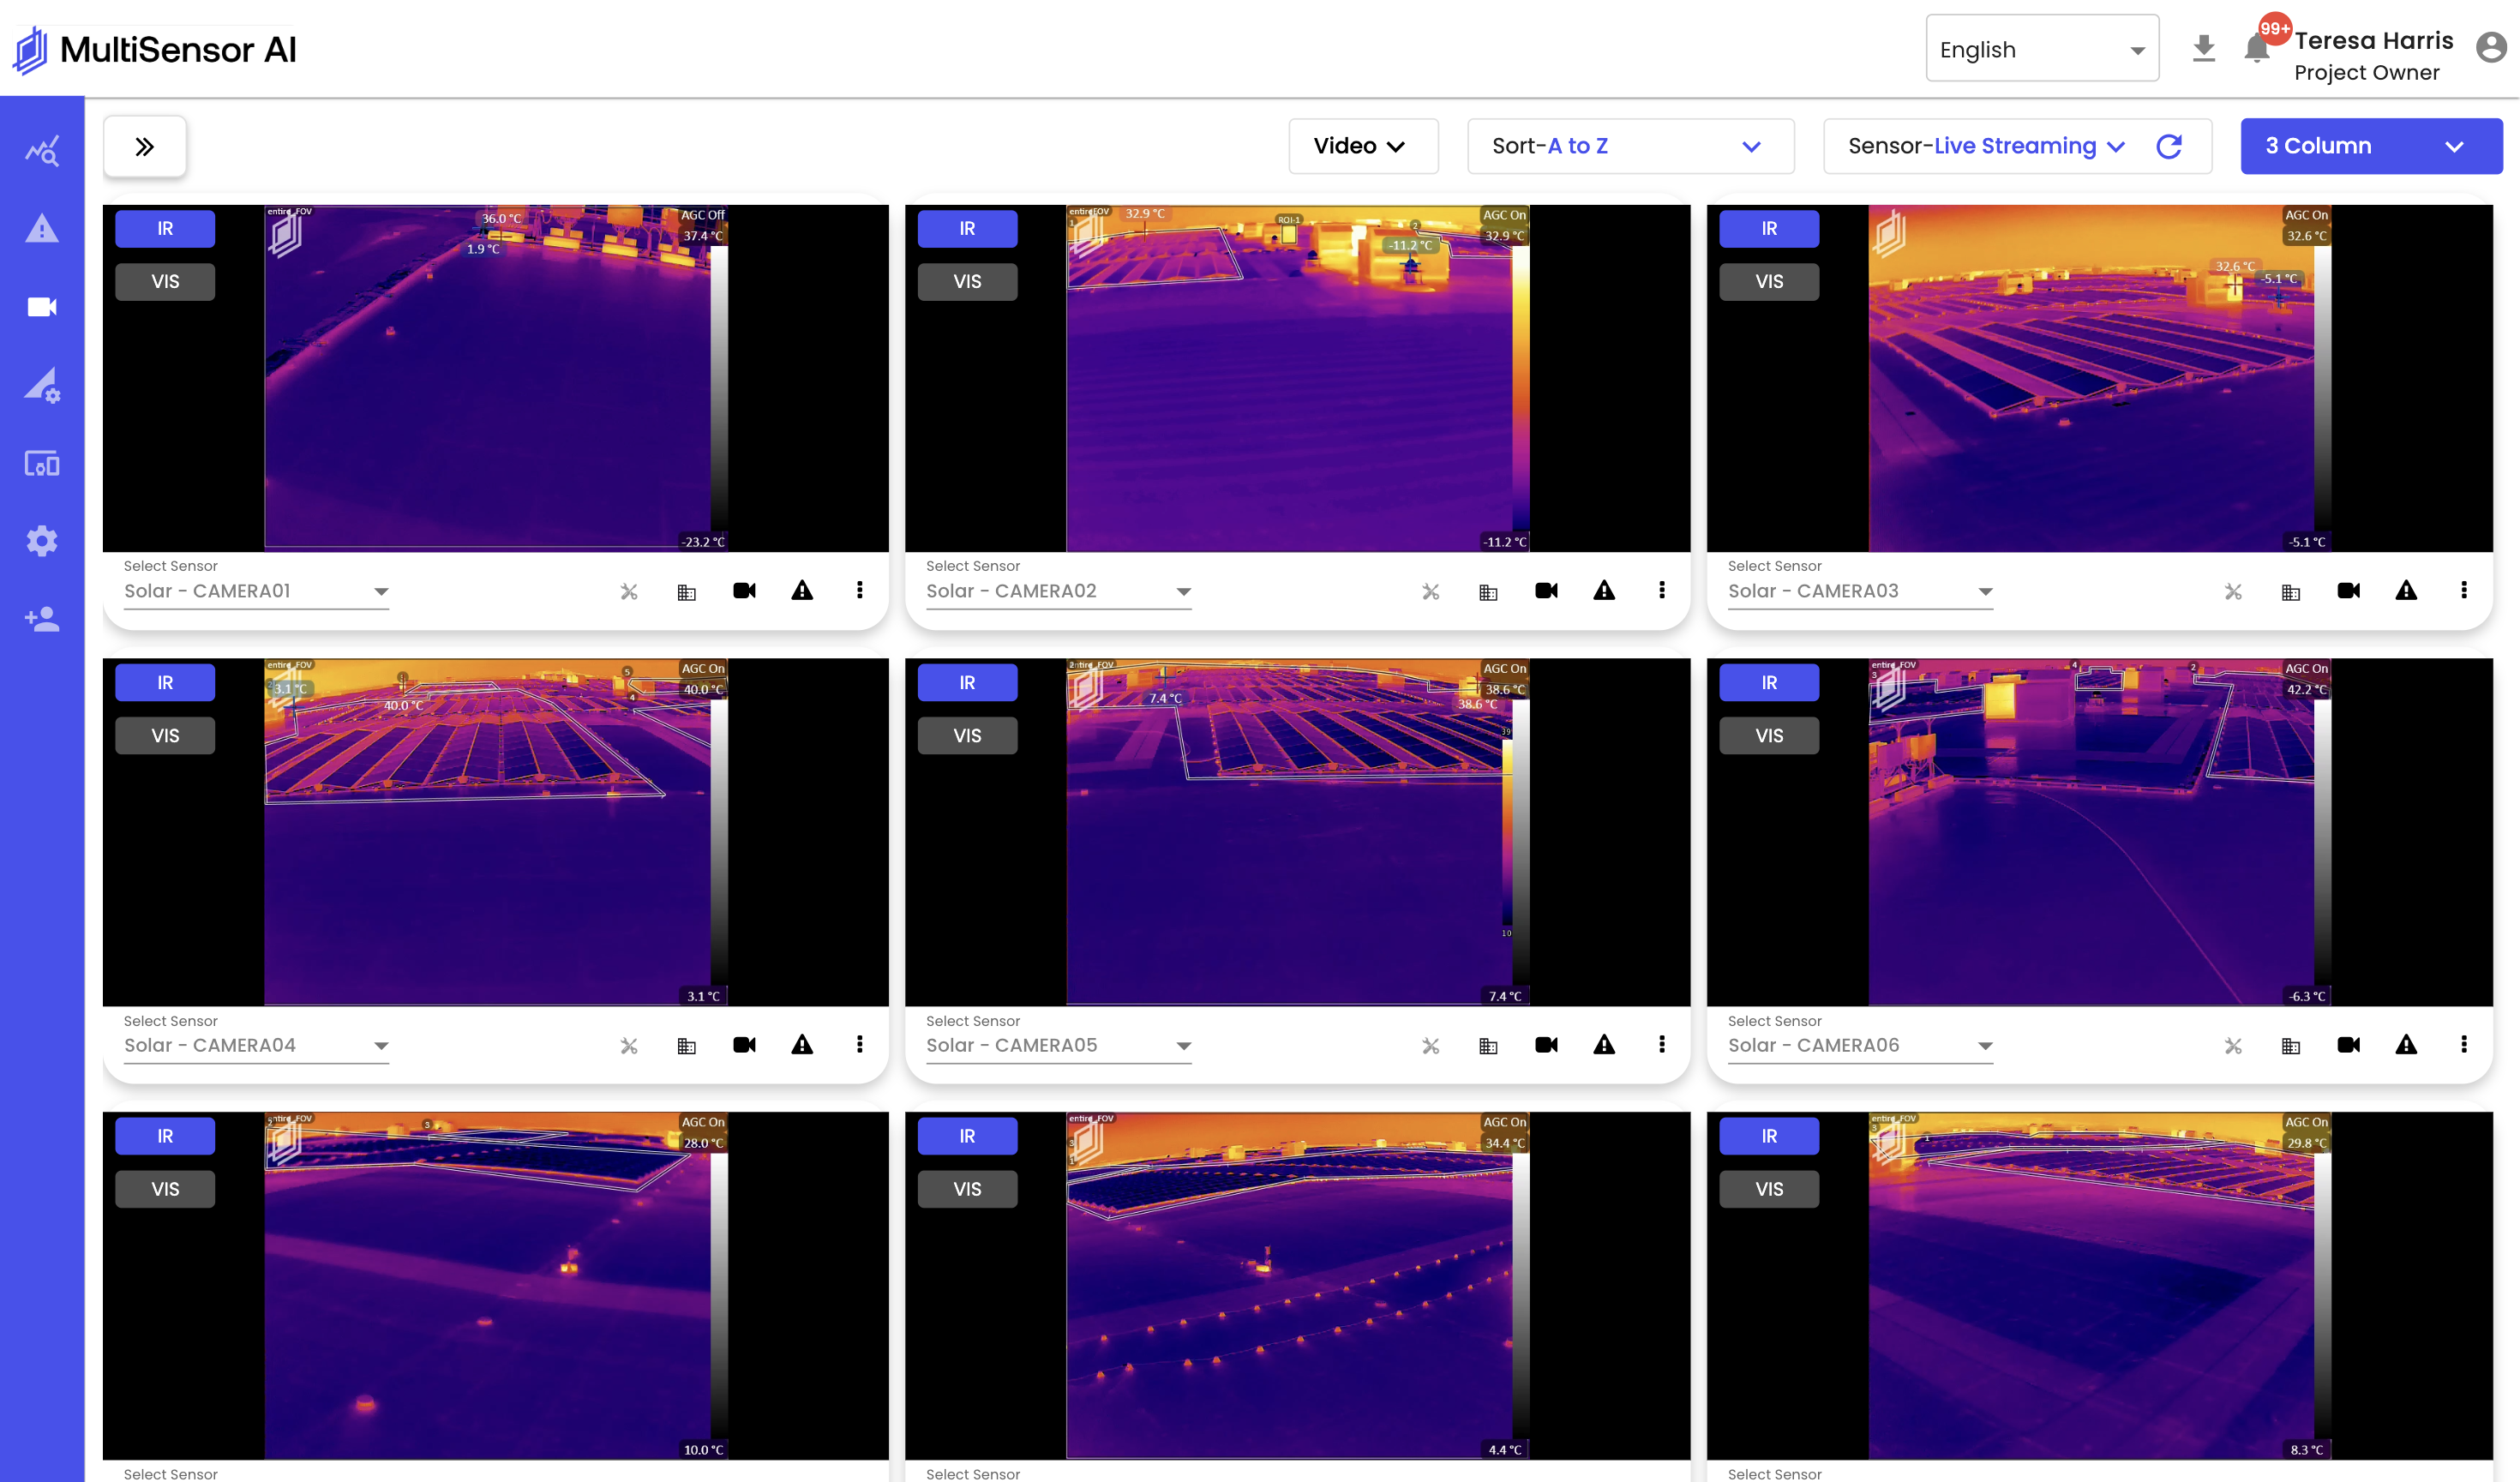
Continuous IR for Solar - Catching Failures before the Roof Does
A distribution operator's rooftop solar was quietly underproducing - and neither SCADA nor the annual drone inspection could say why. The failures that matter most, like a DC ...
The Uptime Preservation Playbook. A Practical Guide to Continuous Monitoring in High-Throughput Operations
This playbook cuts through the visibility gaps that calendar-based inspections and single-sensor monitoring leave behind. Learn how to identify which assets create the biggest ...

MSAI Solutions for Data Centers
This solution brief outlines how MultiSensor AI helps operators detect thermal anomalies, liquid-cooling leaks, overloaded electrical systems, and humidity-related risks before ...

How a Global Retailer Stopped Conveyor Failures Before They Stopped the Line
A Fortune 50 online retailer operates a global network of high-volume distribution facilities, each responsible for moving and sorting thousands of packages daily across ...
Data Driven Maintenance: MultiSensor AI's Luke Grice-Lowe on UE Systems Talking Reliability podcast
.png)
.png)
Factors Affecting Radiometric Temperature Measurements
Improve accuracy. Reduce false readings. Make thermal data you can trust. Most teams using thermal imaging assume they’re getting accurate temperature data—but in reality, ...
Thermal Conveyor Monitoring That Pays for Itself
Solution Brief - MSAI Connect - Thermal Imaging Platform for Critical Asset Monitoring (ft. Global Distribution Warehouse case study) This case study shows how a global online ...
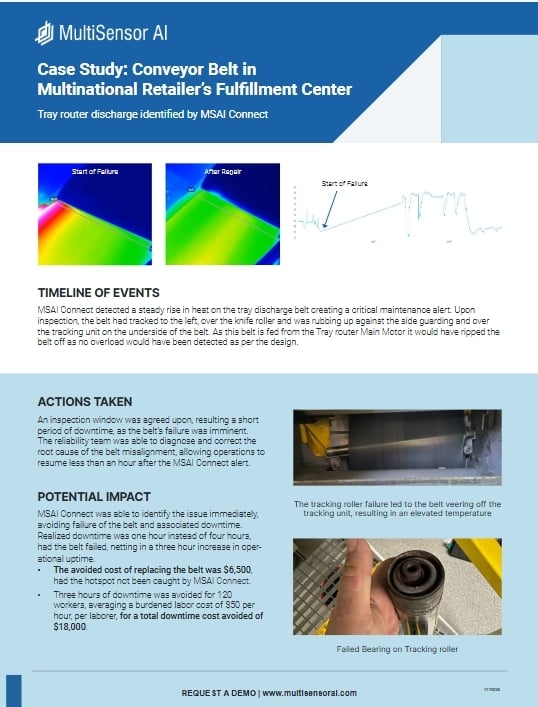
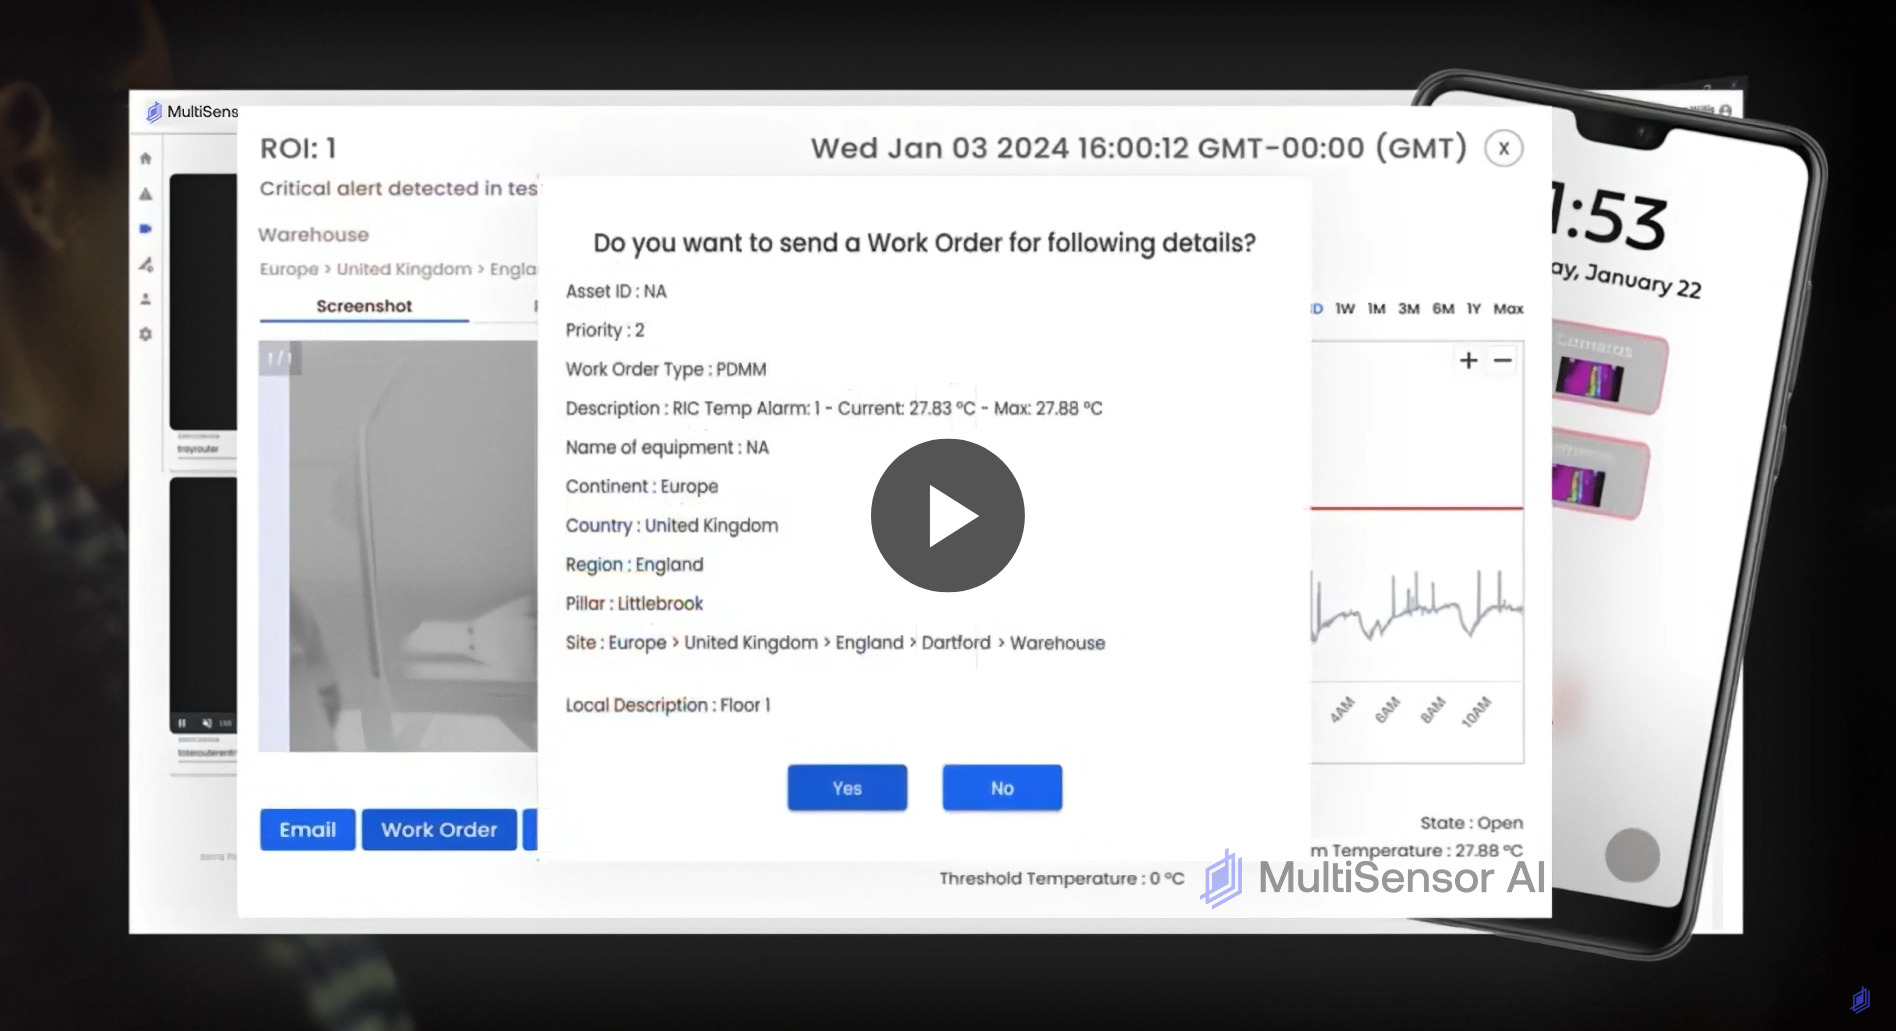
Conveyor Belt in Multinational Retailer’s Fulfillment Center Tray router discharge identified by MSAI Connect
This case study shows how MultiSensor AI detected an imminent tray router discharge conveyor failure in a multinational retailer’s fulfillment center. MSAI Connect identified a ...

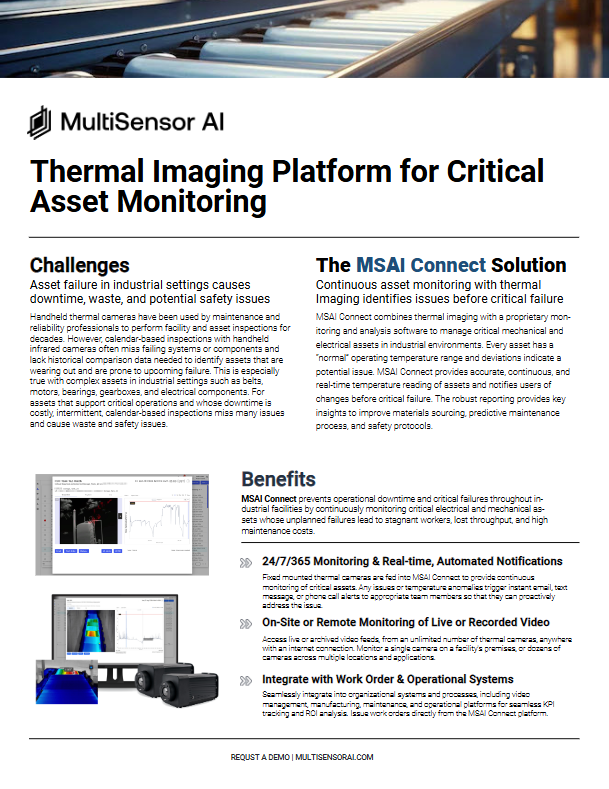
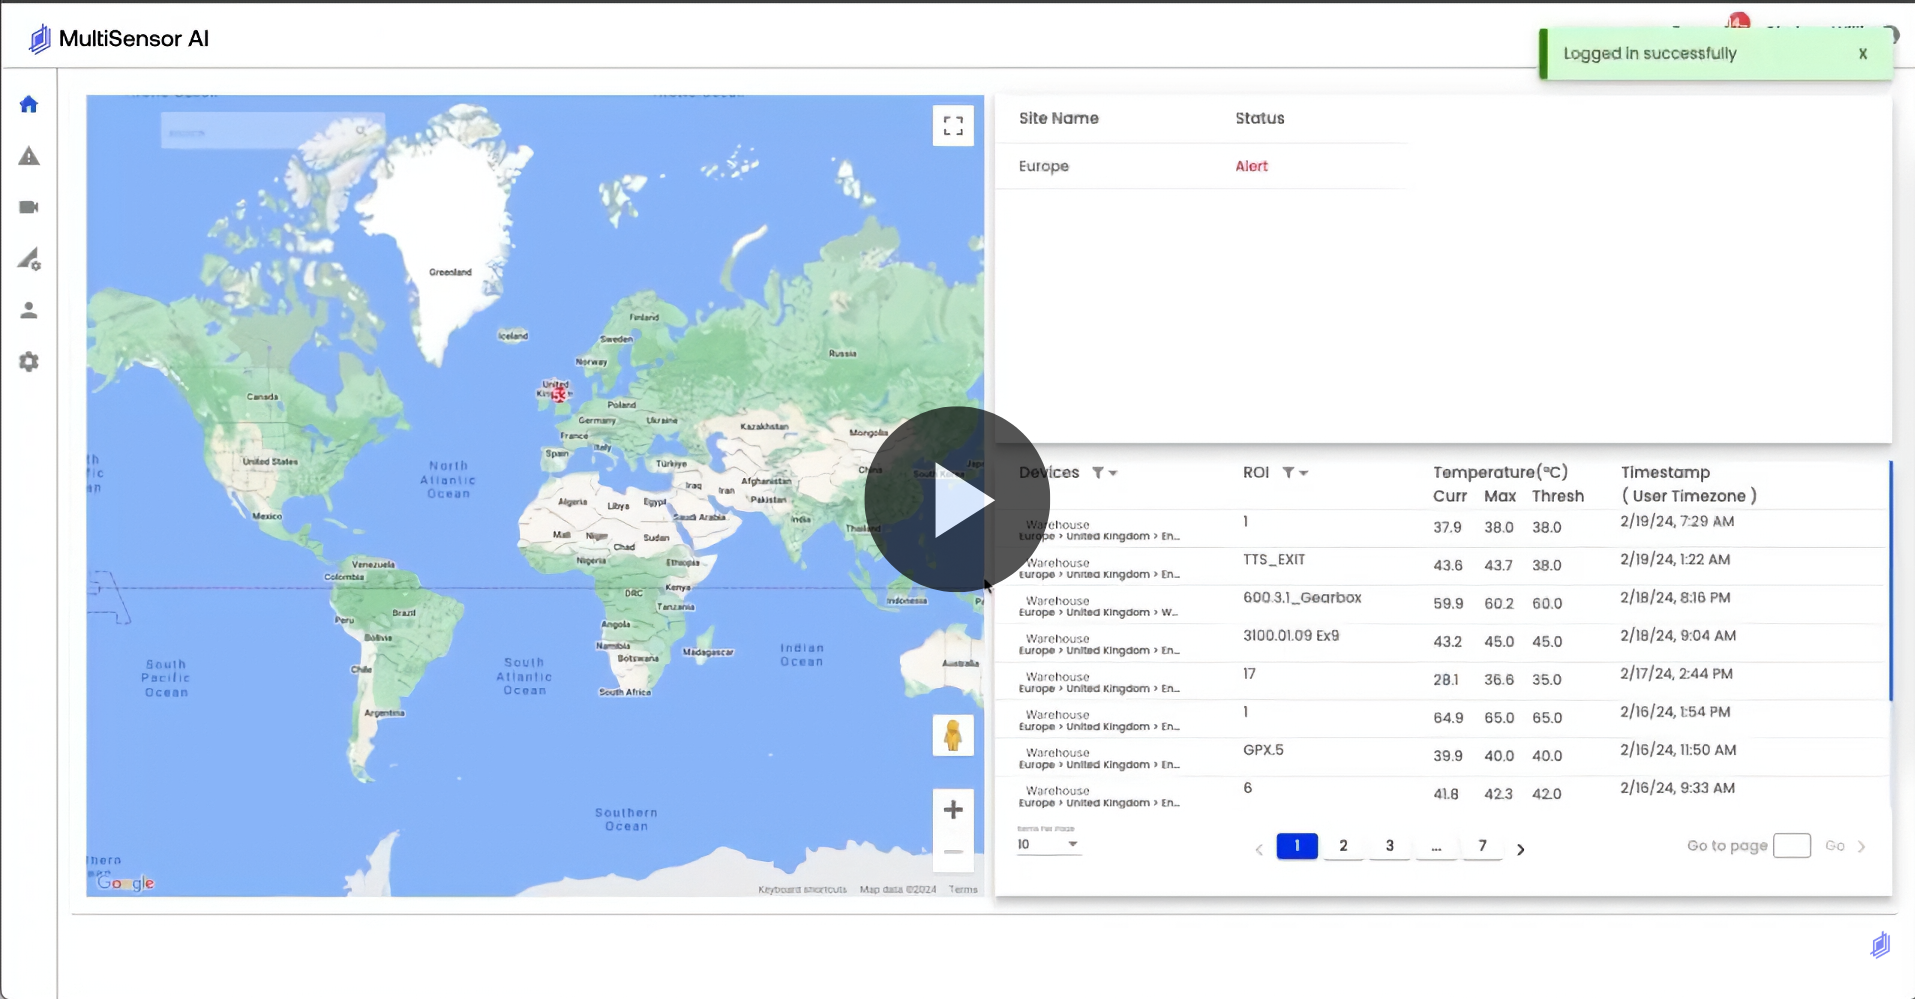
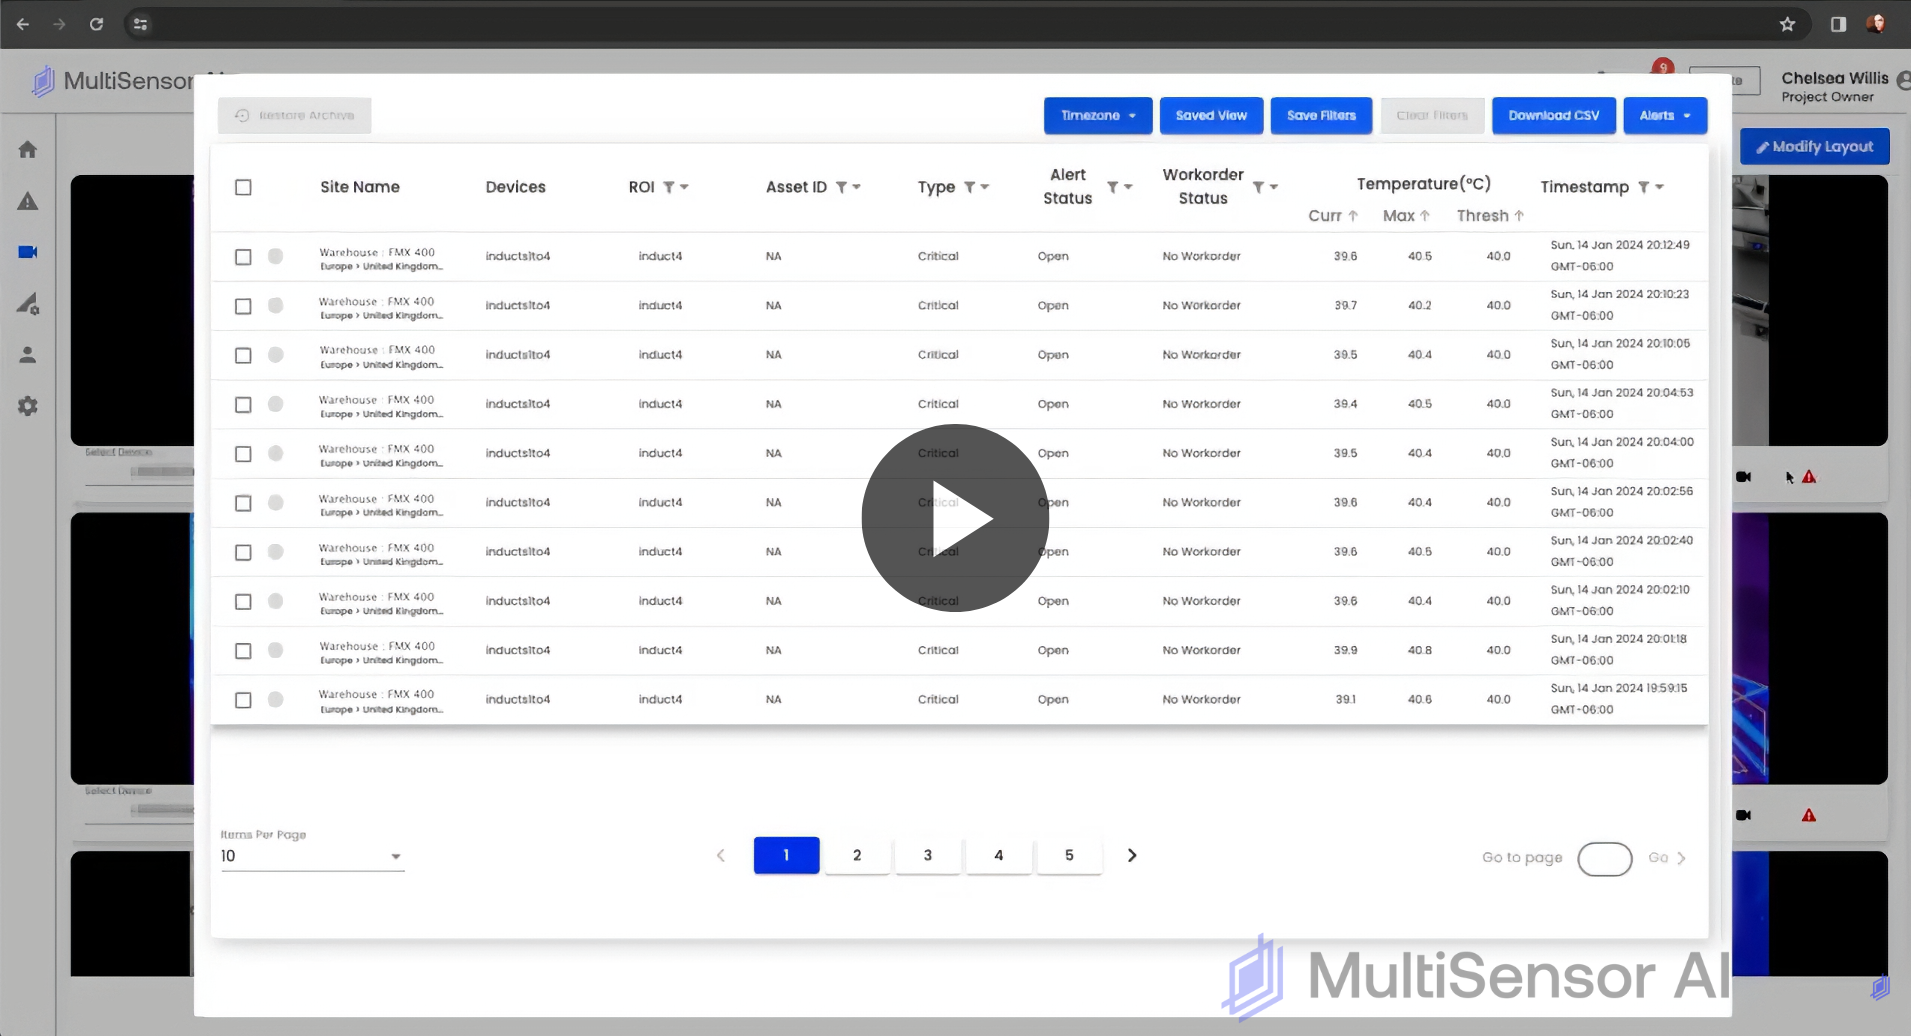
Thermal Imaging Platform for Critical Asset Monitoring
This solution brief explains how MSAI Connect delivers 24/7 thermal monitoring for conveyor belts, motors, bearings, and other critical assets where downtime is costly. By ...
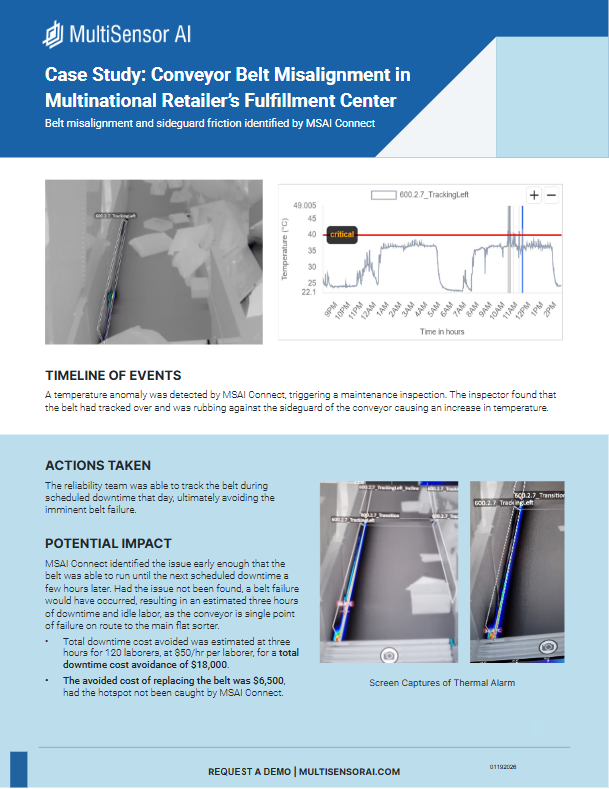
Case Study: Conveyor Belt Misalignment in Multinational Retailer’s Fulfillment Center - Belt Misalignment
This case study shows how MultiSensor AI identified conveyor belt misalignment and sideguard friction in a multinational retailer’s fulfillment center before it caused a ...
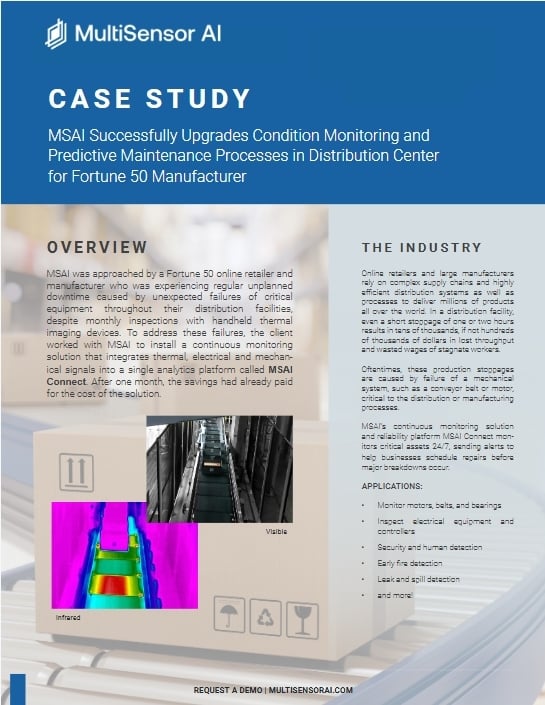
MSAI Successfully Upgrades Condition Monitoring and Predictive Maintenance Processes in Distribution Center for Fortune 50 Manufacturer
This case study shows how a Fortune 50 online retailer used MultiSensor AI to eliminate recurring unplanned downtime across its distribution facilities. Despite regular handheld ...
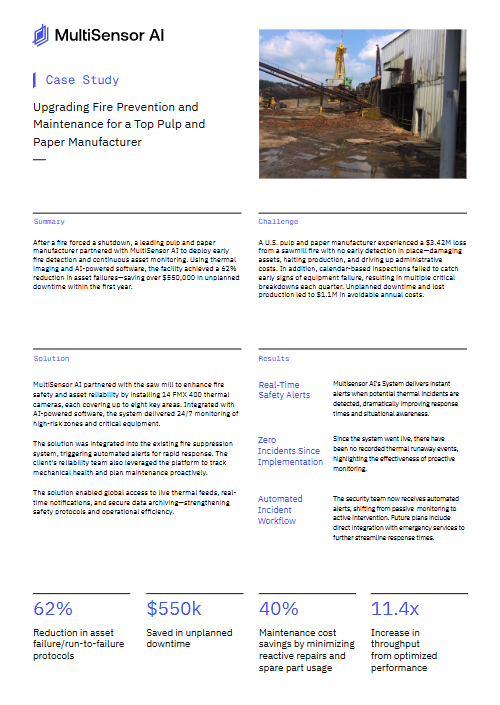
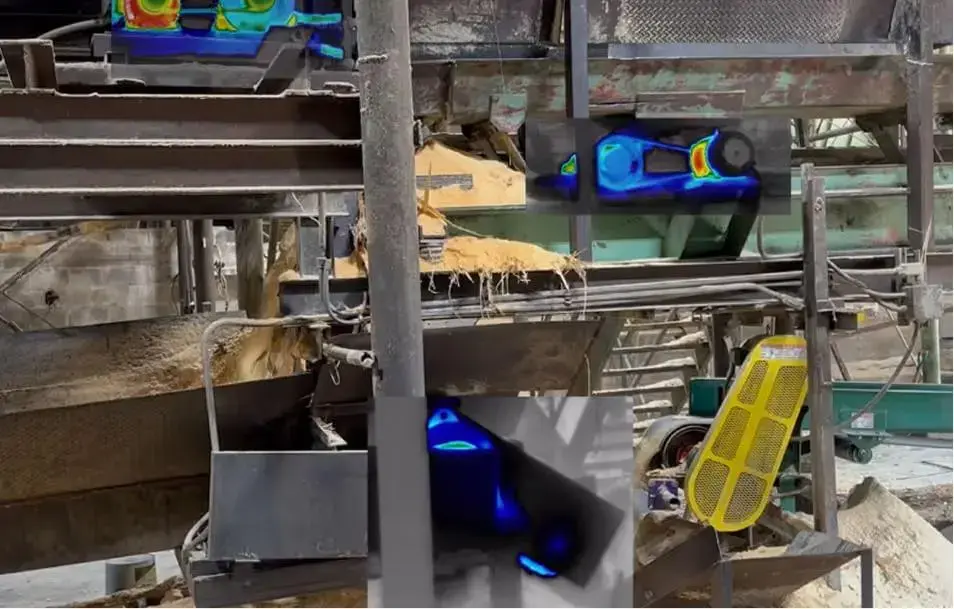
Upgrading Fire Prevention and Maintenance for a Top Pulp and Paper Manufacturer
This case study shows how a leading U.S. pulp and paper manufacturer used MultiSensor AI to prevent fires and reduce unplanned downtime in a high-risk sawmill environment. After a ...
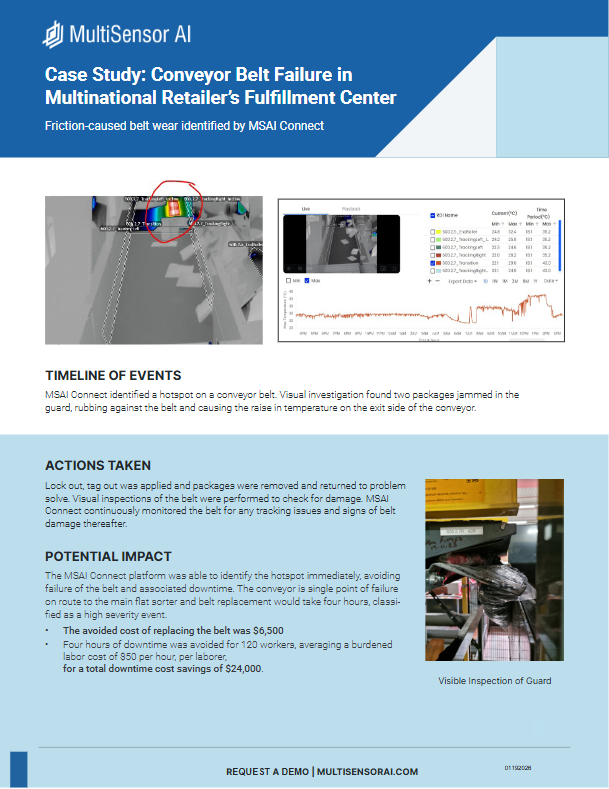
Conveyor Belt Failure in Multinational Retailer’s Fulfillment Center
This case study highlights how MultiSensor AI detected friction-caused conveyor belt wear in a multinational retailer’s fulfillment center before it escalated into a high-severity ...
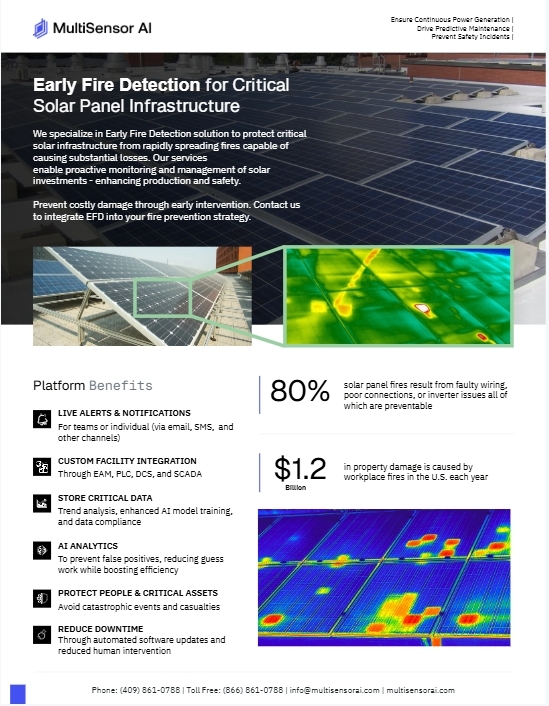
Early Fire Detection for Critical Solar Panel Infrastructure
This one-pager outlines how MultiSensor AI helps solar operators prevent fires and protect energy production through continuous early fire detection. Using fixed thermal cameras ...
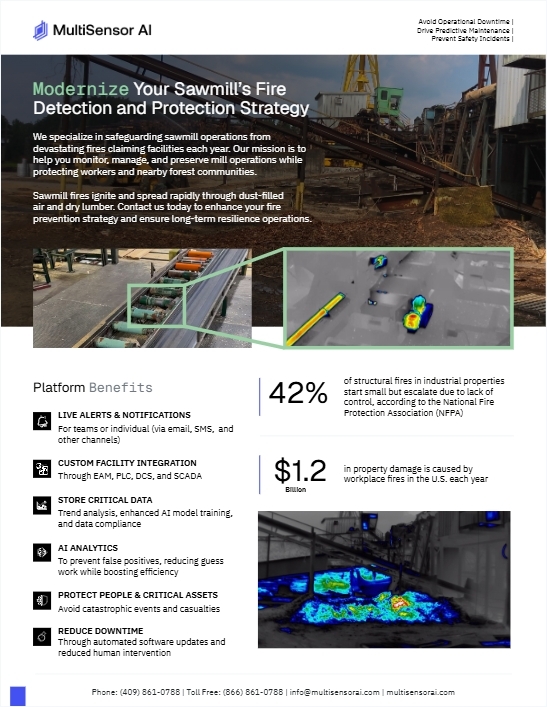
Modernize Your Sawmill’s Fire Detection and Protection Strategy
This one-page case study outlines how MultiSensor AI helps sawmills prevent catastrophic fires, reduce downtime, and improve safety through continuous early fire detection.
.png)

Thermal Monitoring Strengthens Safety and Cuts Downtime at Ford’s EV Battery Testing Facility
Challenge Ford’s EV battery testing facility relied on manual monitoring and basic fire alarms, creating significant risk during lithium-ion battery tests. Without real-time ...

How Data Center Thermal Monitoring Prevents Failures and Delivers 11.4x ROI
The Challenge A major data center suffered a fire without early detection, resulting in $3.42 million in damage, inventory loss, and downtime. Calendar-based inspections weren’t ...
Thermal Monitoring Prevents Failures and Delivers Huge ROI for Global Online Retailer
The challenge High Speed Gapper Beds keep a global online retailer’s fulfilment network moving. But these units had no real-time visibility, relying on manual checks that often ...

How real-time thermal video monitoring got faster, cheaper, and more resilient
Infrared Cameras Inc. (ICI) - a subsidiary of MultiSensor AI - partnered with Amazon Web Services (AWS) to optimize ICI's cloud-based thermal monitoring platform. This technical ...