Condition Monitoring Blog Data Centers Electrical
TL;DR — Thermal Runaway Usually Starts as a Small Resistance-Heating Problem
- Switchgear thermal runaway is rarely sudden. Most events begin as small resistance-heating problems: loose terminations, overloaded feeders, oxidized bus joints, degrading breaker contacts.
- Periodic infrared inspections often miss the escalation window because conditions change between inspection routes.
- Overloaded circuits and loose connections can appear similar in a single thermal image. Trending delta-T and comparing like-for-like components is what separates load heat from fault heat.
- The most important signals are rising delta-T, repeat hotspot behavior at the same physical point, and accelerating temperature gradients.
-
Waiting for breaker trips, discoloration, or burning smells usually means the failure has already progressed into damage-control territory.
Continuous condition monitoring for electrical systems helps reliability teams identify escalation earlier and intervene during planned outages instead of reactive shutdowns.
When “A Slight Hot Spot” Becomes a Shutdown Risk
 Inside an energized MCC cabinet, thermal escalation from loose terminations or overloaded feeders often develops for days or weeks before triggering a protective trip.
Most switchgear thermal runaway events do not begin with dramatic alarms. They begin with small warning signs that are easy to dismiss during routine inspections.
A breaker lug looks “slightly warm” during an IR route. Two weeks later, a load increase pushes that same connection into a severe hotspot. A feeder experiences repeated nuisance trips even though no obvious overload event appears in the logs. A hot termination is re-torqued during maintenance, only for the hotspot to return during the next production cycle. By the time insulation brittleness, discoloration, or arcing evidence becomes visible inside the cabinet, the degradation has often been progressing for weeks.
Thermal runaway is not a mystery event. It is a progression problem. The challenge is determining whether the heat is load-driven or resistance-driven.
There is a non-obvious dynamic that makes this harder to catch: overloaded circuits do not just heat conductors. Sustained elevated temperature accelerates connection degradation through creep, oxidation, and spring tension loss in the termination hardware. That degradation increases resistance, which generates more heat, which accelerates degradation further. What began as an overload condition can transition into a resistance fault without any visible change in the load profile, and a single thermal snapshot cannot separate them.
Why Current Approaches Miss the Escalation Window
IR routes capture a moment, not the heat acceleration
Traditional thermography programs provide only a snapshot of operating conditions. A monthly or quarterly IR inspection may identify a moderate hotspot that appears manageable under current load. But if demand increases, ambient conditions change, or duty cycles intensify after the inspection, the hotspot can escalate rapidly between routes. Many thermal runaway events progress from a flagged-but-deferred anomaly to a critical condition in the days or hours following the last inspection, not before it.
Trip alarms are late indicators, not early condition signals
Protective relays and breaker trips confirm abnormal operating conditions after stress has already accumulated. They do not tell you where resistance is building, how fast the hotspot is accelerating, or whether the heat is load-related or fault-related. The alarm confirms the event; it does not prevent it.
One thermal snapshot cannot disambiguate load heat from fault heat
A single thermal image cannot reliably distinguish distributed heating caused by heavy demand from localized resistance heating caused by a degrading connection. Teams see elevated temperature, assume normal load heating, and defer. Without trending data and comparative context across similar components, loose connections and overloaded circuits get lumped together under “monitor and re-inspect.” By the time the distinction is clear, the intervention window has already narrowed.
| Step 1: Resistance increases at a connection point | Thermal runaway almost always begins at a localized electrical interface where mechanical integrity or surface condition has degraded: loose lug terminations, oxidized bus bar joints, worn breaker stab contacts, fuse clip tension loss (particularly in older equipment), or pitted contactor contact faces. Each creates a high-resistance interface in the current path. Resistance at that interface converts electrical energy into heat proportional to I²R, so even moderate current through a degraded contact generates localized heating disproportionate to the load. |
| Step 2: Heat accelerates degradation and raises resistance further | Once localized heating begins, it drives compounding degradation. Heat accelerates oxidation at the contact surface, increasing contact resistance. Across repeated thermal cycles, differential expansion and contraction loosens mechanical tension in the joint, further reducing clamping force. Sustained heat also damages surrounding insulation, reducing dielectric integrity and increasing fire risk. Each load cycle runs hotter than the last. This is the feedback loop that defines thermal runaway: the failure mechanism makes itself worse with every operating hour. |
| Step 3: Downstream symptoms appear: nuisance trips, arcing risk, equipment damage | As the resistance fault grows, facilities begin seeing symptoms that are easy to misattribute: nuisance trips with no clear overload event in the logs, localized voltage stress at the fault interface, breaker failures on circuits well within rated capacity. Eventually, visible evidence appears inside the cabinet: discoloration, carbonization, arcing marks, or insulation damage found only during an unrelated outage. At that stage, the cost of repair and risk to adjacent equipment is substantially higher than it would have been at Step 1. |
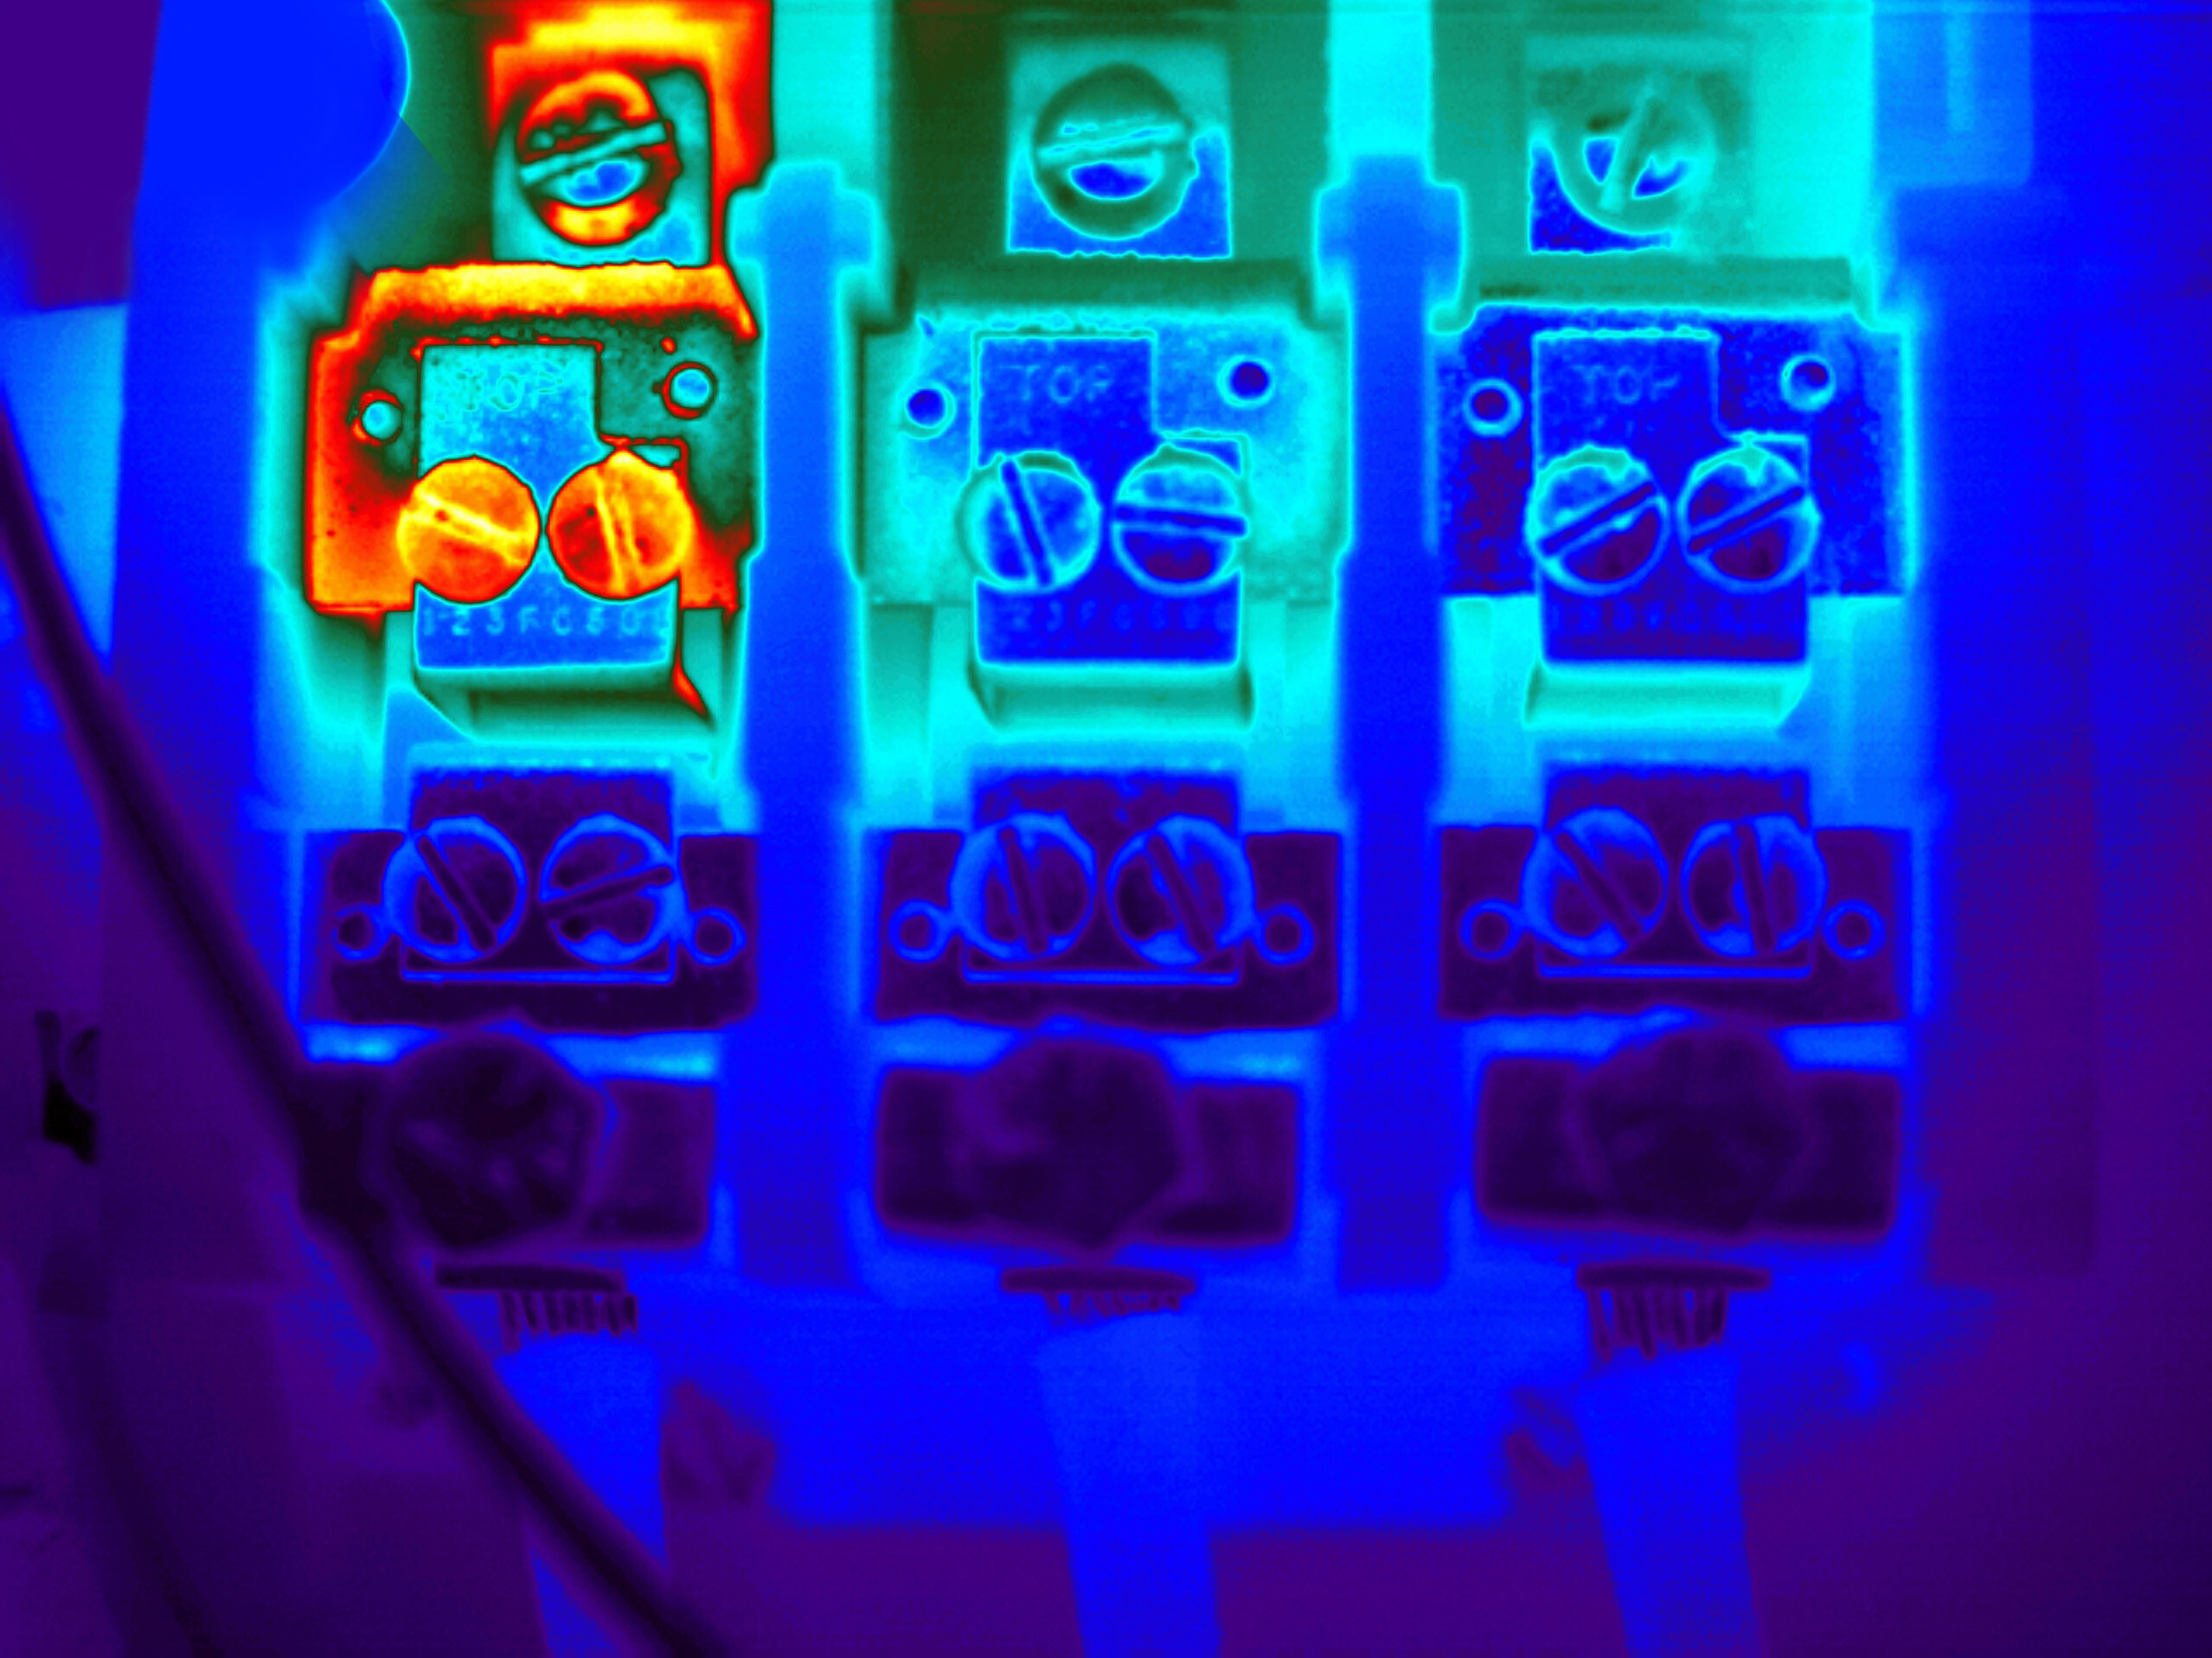
-1.jpg?width=768&height=614&name=0003_IR%20(1)-1.jpg) Thermal overlay of an electrical distribution busbar showing localized overheating at a single lug termination, an early indicator of high-resistance connection degradation that can escalate into arcing, equipment damage, or unplanned downtime if left undetected.
Thermal overlay of an electrical distribution busbar showing localized overheating at a single lug termination, an early indicator of high-resistance connection degradation that can escalate into arcing, equipment damage, or unplanned downtime if left undetected.
Loose Connection vs Overloaded Circuit: How to Tell the Difference Before You Open the Door
Loose or high-resistance connection signature
Degrading electrical connections typically produce a localized hotspot at a specific lug, bus joint, or breaker stab. The key indicators are a sharp phase-to-phase temperature delta at the fault point compared to adjacent terminations carrying similar current, and repeat heating at the same physical location under similar load conditions. The hotspot tends to persist even when overall load is stable or reduced, because the heat is generated by resistance at the contact interface rather than by current magnitude alone.
Overloaded circuit signature
Overloaded circuits typically produce broader thermal patterns along the conductor path and at multiple terminations. Heating is more uniform across phases when loading is balanced, and the temperature profile correlates strongly with known production peaks and duty cycle windows. Heat that disappears during low-demand periods and returns predictably during high-demand windows is consistent with load-driven heating.
Where teams get trapped
The diagnostic challenge is that these two patterns can blend. Sustained overload accelerates connection degradation through creep, oxidation, and tension loss, so what began as distributed overload heating can evolve into a localized resistance fault. This is why comparative baselines and trend data matter more than absolute temperature on any single reading: a delta-T that grows week over week is a different signal from one that stays stable across comparable load cycles.
.png?width=1920&height=1080&name=Untitled%20design%20(10).png) Thermal overlay of an electrical distribution busbar showing localized overheating at a single lug termination — an early indicator of high-resistance connection degradation that can escalate into arcing, equipment damage, or unplanned downtime if left undetected.
Thermal overlay of an electrical distribution busbar showing localized overheating at a single lug termination — an early indicator of high-resistance connection degradation that can escalate into arcing, equipment damage, or unplanned downtime if left undetected.
How to Detect Thermal Runaway Earlier
Signals that matter, and what they usually indicate
The most valuable indicators are not absolute temperature alone. Reliability teams should track:
-
Rising temperature delta between a specific termination and adjacent connections carrying similar current
-
Repeat hotspots at the same physical point across multiple operating cycles
- Accelerating thermal rise rate: a connection that is getting hotter faster under the same load
- Phase-to-phase temperature imbalance at similar termination types
- Current imbalance or abnormal load persistence from existing electrical metering, where available
- Recurring heat that appears during specific operating windows and escalates cycle over cycle
-
-
A combination of rising delta-T with repeat hotspot behavior at the same point is a strong indicator of resistance-driven degradation rather than load heat.
Why continuous monitoring changes the diagnosis
Continuous condition monitoring captures not just the presence of a hotspot, but when it appears, how quickly it escalates, and whether it correlates with specific load conditions. That temporal dimension is what periodic IR cannot provide. The slope of the trend, not the peak temperature at a single point in time, is the diagnostic variable that separates a manageable condition from an urgent one.
Multi-sensor corroboration to reduce false calls
Thermal data alone can generate false positives in environments with variable ambient conditions, airflow obstructions, or intermittent high-demand cycles. Combining thermal trend data with electrical context, including current draw on the affected phase, load patterns, and physical context such as panel door state, distinguishes “hot because busy” from “hot because failing” more reliably than either signal source alone.
 MSAI Connect interface showing continuous thermal monitoring and temperature trend analysis inside energized switchgear, helping reliability teams detect progressive electrical overheating before threshold alarms or functional failures occur.
A Practical Framework for Preventing Switchgear Thermal Runaway
Step 1: Identify the highest-consequence switchgear sections
Start with sections feeding single points of failure: conveyor drive lines and sortation systems, UPS and PDU distribution, chiller and pump motor control, and any feeder panel where a trip would cascade across multiple downstream systems. Prioritize by operational consequence, not equipment age or replacement cost.
Step 2: Baseline temperature patterns under normal load
Before setting alert thresholds, establish what normal looks like. Capture thermal profiles across phases and similar feeder terminations during peak load, sustained mid-load, and idle windows. Baselines enable like-for-like comparisons and surface pre-existing conditions before monitoring goes live, which is important for distinguishing new degradation from stable legacy conditions.
Step 3: Track delta-T and rise rate, not just absolute temperature
Set alert logic around two variables: the temperature delta between a monitored connection and its adjacent reference points, and the rate at which that delta is changing. A single elevated reading may reflect load conditions. A reading that is elevated and trending upward across comparable load windows is a different signal. Delta-T and slope are more specific and more actionable than absolute temperature thresholds alone.
Step 4: Classify overload-driven vs resistance-driven heating
When an alert fires, apply the pattern rules: Is the hotspot localized at a specific termination or distributed across conductors? Does it correlate with known duty cycle peaks or appear independent of load? Is the delta-T growing? A localized hotspot with growing delta-T and no load correlation is a resistance fault until proven otherwise.
Step 5: Act inside the intervention window
Acting inside the intervention window means scheduling corrective work during a planned outage: re-torquing a termination, replacing a degraded breaker or contactor, restoring oxidized bus joints, or load-balancing across phases. None of these tasks is complex or costly when performed proactively. All of them become significantly more expensive after an unplanned trip.
Step 6: Close the loop after repair
After corrective work, verify the hotspot trend returns to baseline under similar load conditions. If the same point shows elevated temperature in the next comparable operating window, the root cause may not be fully addressed. Verification also builds the data record that documents the condition at detection and confirms the outcome of the repair.
| Scenario: A ‘Warm’ Breaker Lug Becomes a Thermal Runaway Event After Peak Season Load |
| Situation: A parcel sortation facility adds temporary peak-season load on a feeder panel supplying sortation drives. An IR survey two weeks earlier flagged a moderate hotspot at one breaker lug, but it was below the defined action threshold and deferred to the next inspection cycle. |
| What was missed: The critical escalation occurred during evening peak demand windows, between the inspection snapshot and the next scheduled route. The hotspot progressed from moderate to severe over three high-demand shifts, undetected. |
| Signal progression: Slight hotspot at lug detected on IR route. Rising delta-T and faster temperature ramp under the same load across subsequent cycles. Insulation discoloration developing at the lug. Nuisance trip risk emerging on the affected feeder. |
| Action: Reclassify as resistance-driven heat based on localized hotspot pattern and growing delta-T independent of load variation. Schedule a controlled outage to re-terminate the lug and inspect adjacent connections. After repair, verify the hotspot trend returns to baseline under similar load conditions before returning the feeder to full seasonal demand. |
| Result: Feeder remains online through peak season. Corrective work executes during a planned maintenance window. No unplanned trip, no secondary insulation damage, no cascading sortation downtime. |
Conclusion: Don’t Wait for a Trip to Prove You Have a Problem
Switchgear thermal runaway is usually visible long before it becomes a failure event. The signals are there: a rising temperature delta at a specific termination, a hotspot that returns after re-torque, a thermal trend that steepens across comparable load cycles. What makes those signals actionable is the ability to see the progression, not just the peak.
The key diagnostic question is not whether heat is present, but whether it is load-driven or resistance-driven, and whether the delta-T is stable or growing. Continuous condition monitoring for electrical systems provides the trending context to answer that question before the intervention window closes.
Re-terminations and hardware replacements scheduled during planned outages are straightforward maintenance tasks. The same work performed as emergency response after an unplanned trip, with expedited parts, overtime labor, and potential secondary damage to connected equipment, is a different problem entirely. The difference between those two outcomes is detection timing.
Explore Electrical Fault Detection for Panels, MCCs & Switchgear → multisensorai.com/use-cases/electrical-fault-detection
FAQ
What is switchgear thermal runaway?
Thermal runaway is a feedback loop where rising resistance at a connection or contact creates heat, and that heat increases resistance further, accelerating until a trip, arcing, or insulation damage event occurs. It is a progression failure, not a sudden event.
What causes thermal runaway in switchgear most often?
Loose or improperly torqued terminations that allow oxidation to develop at the contact interface, degraded breaker stab contacts, fuse clip tension loss, and overloaded circuits that accelerate connection degradation through creep and oxidation.
How do I tell if the heat is overload-related or a loose connection?
Overload heat is usually distributed across conductors and correlates with known duty cycles. Loose connections create a localized hotspot with a growing temperature delta at a specific point, often independent of changes in overall load.
How often do IR inspections miss thermal runaway events?
Any time escalation occurs between inspection routes or during load windows the inspection did not capture. The structural problem is a P-F interval mismatch: thermal runaway in a resistance fault can progress from a detectable anomaly to a critical condition in hours to days, which is shorter than monthly or quarterly IR intervals can reliably intercept.
What temperature pattern should trigger action?
A repeat hotspot at the same termination with increasing delta-T versus adjacent connections, especially when the rise rate is accelerating under similar load conditions. Absolute temperature alone is less informative than the trend.
Does condition monitoring replace protective relays or power monitoring?
No. Condition monitoring complements protective relays and metering by providing earlier visibility into degradation trends before protective devices activate. It adds the asset-level condition signals, such as thermal trend and load correlation, that allow intervention before the fault reaches a trip threshold.
Keep reading

MSAI Connect Thermal Monitoring Condition Monitoring Blog Vibration
You Have Condition Monitoring—But Here's What It's Probably Missing

Condition Monitoring Blog Data Centers Electrical