
Condition Monitoring Reliability Engineering Blog
TL;DR
- Every maintenance strategy is really just a choice about where on the P-F curve you catch a failure.
- The P-F curve maps the window between Point P (the first detectable sign of degradation) and Point F (the point an asset can no longer do its job as intended, even if it is still running).
- Detect too early and you eat into a part’s useful life through unnecessary replacement and over-maintenance. Detect too late and you add ancillary damage, higher parts consumption, longer repair times, and lost throughput. The value sits in between.
- The P-F interval isn't fixed. It changes by failure mode and asset, which is why a “regular” inspection schedule can still miss a fast-moving failure.
- Matching detection frequency to the actual P-F interval, failure mode by failure mode, separates a program that catches problems early from one that just owns more sensors.
-
Take the two-minute Reliability Maturity Assessment to see where your operation sits.
When “we inspect it” isn't the same as “we'll catch it in time”
A conveyor drive bearing passes a monthly inspection with a clean report. Three weeks later, it seizes mid-shift, taking the merge conveyor down with it and backing up everything upstream and downstream of the failure. Nothing about that inspection was wrong; the bearing genuinely was fine when someone looked at it. “Fine at the last check” and “fine right now” are different claims, and the gap between them is where failures live.
That gap has a name and a shape. Reliability engineers call the shape the P-F curve, and the specific window inside it the P-F interval, two related but different things. Getting that distinction right explains why some maintenance programs catch failures as proactive work orders while others catch them as breakdowns.
The part that surprises people: The goal isn’t detecting degradation as early as physically possible, and the earliest signal changes with the failure mode. On a bearing, ultrasound and vibration analysis can flag the first signs of wear well before any action is needed. On a tracking belt, the bearing may be fine, and thermography becomes your earliest detection because friction heat shows up first. Detect too early and you replace parts with useful life left. The goal is catching the signal where it’s real, with time left to plan.
Why periodic inspection and OEM alarms both miss the point
Calendar-based inspection assumes degradation moves at a pace that lines up with the inspection schedule. It usually doesn't (a problem solved by condition monitoring). A monthly or quarterly inspection is a snapshot, accurate only at the instant it's taken. If a bearing or a loose termination degrades faster than the inspection interval, the asset can move from healthy to failed between visits, and no one was wrong to have missed it. As one MSAI reliability engineer put it:
“Scheduled maintenance is a snapshot in time. It's only effective from the moment you walk away. Once you've walked away, that inspection's out of date—the condition could have changed and you don't know.”
OEM and PLC alarms fail the opposite way. They confirm a fault state rather than warn ahead of one, with thresholds set at functional failure. In most cases they also only tell you the effect of the fault, not the cause. By the time an alarm fires, there's no runway left. Both approaches watch the same asset; neither watches at the point where action is still optional.
Explaining the P-F Curve and the P-F Interval
The P-F curve names two points on any asset's decline.
Point P (Potential Failure) is the earliest moment a degradation signal becomes detectable: a shift in a bearing’s vibration or ultrasound signature, a warming control cabinet terminal, a belt starting to track off center.
Point F (Functional Failure) is the moment the asset can no longer do its job effectively. That doesn't always mean a dramatic breakdown; an asset can be running and still have reached functional failure if it no longer meets throughput, quality, or safety requirements.
The stretch between P and F, the P-F interval, is the window available to plan, schedule, and resolve the issue before it becomes unplanned. Every repair inside that window is planned. Every repair after F is reactive, and the U.S. Department of Energy puts reactive maintenance at 3 to 5 times the cost of planned work, driven by emergency labor, expedited parts, and ancillary damage.
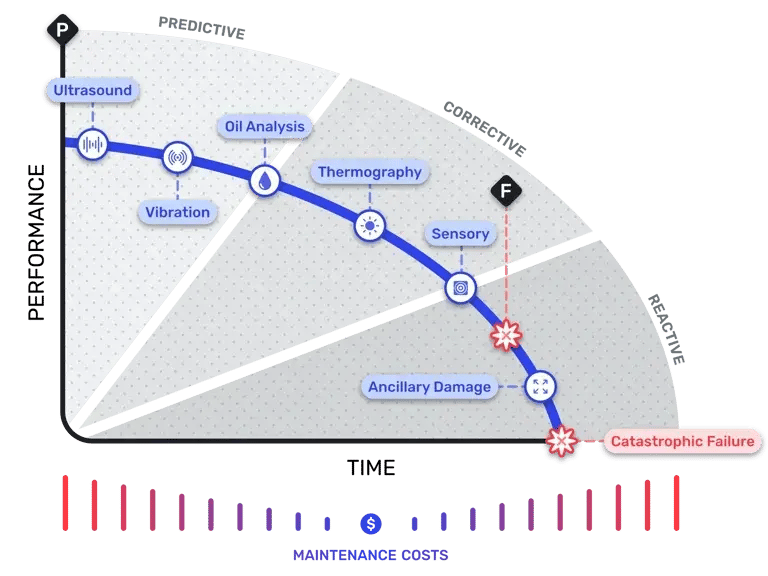
The part that trips people up: The P-F interval isn't fixed. A sorter drive bearing can move from detectable to seized in hours. A loose termination in an MCC cabinet can take weeks. Same curve shape, a different clock. One caveat: This is not an exact science. No approach catches every fault. Some failures leave no time to react, and many non-engineering variables, like parts availability, access, and production schedules, eat into the P-F interval before anyone can act.
How to detect earlier, on the interval that actually matters
For any inspection or monitoring approach to work, it has to run at a frequency shorter than the P-F interval of the failure mode it's meant to catch, with margin left to act. That's closer to a structural requirement than a best practice: An inspection cycle longer than the failure's runway will eventually miss it, no matter how careful the inspection is.
The right detection method depends on what's actually failing, not a blanket rule. For bearing wear, vibration and ultrasound tend to catch the earliest signal; heat only shows up once the bearing is already in active failure, so a thermal reading there means it's time to move quickly, not that there are months of runway left. For electrical terminations and issues like belt tracking, thermal is often the earliest reliable signal available. Sensory checks (sight, sound, smell) sit closest to Point F for most Tier 1 assets, but for lower-criticality equipment where run-to-failure is an acceptable strategy, they can be the primary method, not just a backstop.
The right detection method depends on what’s actually failing, and no single method is earliest for every failure mode.
On a bearing, ultrasound and vibration analysis typically catch the earliest signal. By the time a bearing is generating measurable heat, it’s already in active failure, so a thermal reading doesn’t buy you runway. It tells you to move quickly.
On a tracking belt or a loose electrical termination, the order flips. Friction or resistance shows up as heat first, so thermography becomes your earliest detection, and a vibration-only program can miss electrical faults entirely. Each method sees a different point on the curve for a different failure mode.
Then there are our own senses. If human senses were as sensitive as thermography, ultrasound, and vibration analysis, we wouldn’t need the tools. Sight, sound, and smell sit closest to Point F on every failure mode, which makes them a poor early warning. For lower-criticality equipment where run-to-failure is acceptable, though, they can be a perfectly good primary strategy.
What to do about it
Start by naming the failure mode that matters for a given asset, not “failure” in general. A conveyor bearing, a VFD termination, and a belt tracking issue don't share a P-F interval, so they shouldn't share a detection plan.
Estimate that failure mode's typical P-F interval using industry data as a starting point, then validate it against your own CMMS history, since load, speed, and environment all stretch or compress it. A quick way to check your assumption: pull the CMMS work order history for that asset class and count how many breakdowns or corrective work orders happened inside your current inspection interval. That count tells you fast whether the interval is actually doing its job.
Finally, match detection frequency to that interval with margin to spare. If the interval is shorter than your inspection cycle, that inspection was never going to close the gap. If it’s comfortably longer, a well-timed periodic inspection may be enough.
Every option carries a trade-off. Inspect or monitor more and you spend more labor, data, and attention. Inspect less and you accept more risk of an unplanned failure. Weighing that risk against the reward is your call, and a good criticality assessment makes the decision easier by showing which failure modes can absorb a surprise and which can’t.
Where to go from here
Detection latency's cost, and how much reliability maturity varies between operations, trace back to how much of the P-F interval actually gets used. For the full breakdown of P-F intervals by asset class, get the Detection Latency Blueprint.
Or schedule a demo to see more.
FAQs:
What is the P-F curve in maintenance?
A model mapping an asset's decline from the first detectable sign of degradation (P) to the point it can no longer do its job (F). The interval between them is the window for planned repair.
What's the difference between Point P and Point F?
Point P is the earliest moment a change in condition becomes detectable. Point F is the moment the asset can no longer perform its intended function effectively.
How long is a P-F interval?
It varies by failure mode, asset, load, and operating environment. Some failure modes progress quickly and others develop slowly, so validate against your own failure history.
Why doesn't inspecting more often close the gap?
Because inspection frequency has to be shorter than the P-F interval of the failure mode you’re tracking, and every added inspection uses labor that could go where it’s actually needed. Match frequency to the failure mode and the asset’s criticality instead of adding routes.
Is earlier detection always better?
No. Detecting far too early can flag issues long before action is warranted, leading to premature part replacement and alerts a team eventually starts ignoring.
How does the P-F curve relate to detection latency and reliability maturity?
Detection latency is how much of the P-F interval gets used up before anyone notices. Reliability maturity is how consistently an operation catches failures early in that interval instead of at or after Point F.
Keep reading
Thermal Monitoring Condition Monitoring Blog
Condition Monitoring Alert Fatigue Is a Design Problem, Not a Tuning Problem

Thermal Monitoring Condition Monitoring Blog