Updated August 2026
Thermal imaging is one of the most reliable diagnostic tools in industrial maintenance. Point an infrared camera at a motor control center and you can see a loose connection heating up weeks before it fails. That is real, and it is why thermal imaging has been standard practice in reliability programs for decades.
The limitation is not the physics. It is the schedule.
Most facilities run thermal imaging as a route: a technician walks the plant monthly, quarterly, or annually, captures images, and files a report. Everything the camera sees on that walk gets caught. Everything that develops between walks does not.
For assets that degrade over months, a quarterly route is adequate. For a sorter drive motor that goes from normal to failed in nine days, or a UPS connection that begins heating on a Tuesday and takes the facility down on a Friday, the route is a coin flip.
What thermal imaging reliably catches
Infrared is strongest where failure produces heat before it produces a stoppage. In practice that means four categories.
Electrical faults. Loose or corroded connections, unbalanced phases, and overloaded circuits all show up as thermal anomalies well before they trip anything. This applies across UPS systems, switchgear, PDUs, distribution panels, and motor control centers.
Drive and control faults. VFDs running hot signal cooling problems, failing capacitors, or a drive working harder than it should against a mechanical fault downstream. PLC cabinets show the same pattern.
Rotating equipment degradation. Bearing wear, misalignment, belt friction, and lubrication failure generate friction heat. A conveyor motor with a failing bearing runs measurably hotter than its neighbours on the same line, which is why comparative thermal readings across identical assets are often more diagnostic than any single absolute temperature.
Process and quality variance. Uneven heat distribution across a product or a process surface reveals inconsistency that visual inspection misses entirely.
Where periodic thermal imaging goes blind
Four gaps open up when thermal imaging is delivered as a scheduled route rather than a continuous feed.
The interval itself. An annual infrared inspection produces a twelve-month blind spot. A quarterly route produces four ninety-day blind spots. Degradation does not wait for the technician.
Load conditions at the moment of capture. A drive that runs cool at 40% load and overheats at peak tells you nothing useful if the route happens on a slow Tuesday morning. Many faults are only visible under the conditions that cause them.
Access. Energised switchgear, elevated conveyor drives, and equipment behind guarding are difficult or unsafe to reach with a handheld camera, so the assets that carry the most risk are often the ones inspected least thoroughly.
Trend, not snapshot. A single reading of 62 degrees means little on its own. The same asset climbing three degrees a week for five weeks is a clear signal. Route-based inspection produces disconnected snapshots, rarely the trend line.
None of this argues against thermal imaging. It argues that the value of thermal data scales with how often you collect it.
Where the gap costs the most
E-commerce and retail distribution centers
In a high-volume distribution centre, the sorter does not just sort. It is the throughput engine, the SLA clock, and the labor multiplier. When it fails, everything stops.
The exposure concentrates in single-point-of-failure assets: the high-speed sorter, the MCC and VFD bank, the induction system, the trunk conveyor. Electrical degradation in those assets builds invisibly over days. Mechanical wear on conveyor motors, rollers, and drive bearings accelerates without visible symptoms until it is too late.
Peak season compresses that exposure into the weeks a facility can least afford it. In MSAI's 2026 research with Censuswide, 45% of facilities push 31 to 45% of annual volume through their busiest four-week period, and 95% of VP-level operations leaders said a major downtime event would match or exceed their entire annual automation investment.
A quarterly infrared route through a facility like that inspects the sorter three or four times a year.
Related reading: electrical fault detection · VFD and PLC drive fault detection · rotating equipment monitoring · warehousing and logistics
Couriers and express parcel hubs
A parcel hub does not have a second chance. If the sort fails, the dispatch window closes, and the network feels it.
Hub failures propagate. One hub going down moves through linehaul and delivery commitments across the network, which turns a local mechanical problem into an SLA problem. High-speed sortation running at full utilisation leaves almost no recovery time.
Electrically driven degradation in MCCs and VFDs is the most frequent source of hard stops in these environments, and the hardest to catch without continuous coverage. The specific assets that matter: high-speed sorter drives, merge conveyors, divert cluster motors and actuators, induction line bearings, and hub power distribution.
Related reading: automation and robotics fault detection · condition monitoring
Enterprise and regional data centers
In a data center, redundancy is the safety net. The moment a UPS, switchgear component, or cooling unit begins to degrade invisibly, that redundancy margin is quietly being consumed.
This is where annual infrared inspection is most common and least sufficient. A twelve-month interval on UPS systems, switchgear, and PDUs means a developing electrical fault has a year of runway. Building management and DCIM systems help, but they report when something has broken rather than when it has started to fail. MSAI operates above BMS and DCIM to make that degradation visible while the margin still exists.
On the cooling side, the assets that carry the risk are chillers, CRAH and CRAC fans, chilled-water and condenser-water pumps, and cooling tower fans.
The economics are well documented. According to the Uptime Institute's Annual Outage Analysis 2026, 57% of major data center outages cost more than $100,000, and one in five exceed $1 million.
Related reading: data center condition monitoring
What continuous multi-sensor monitoring changes
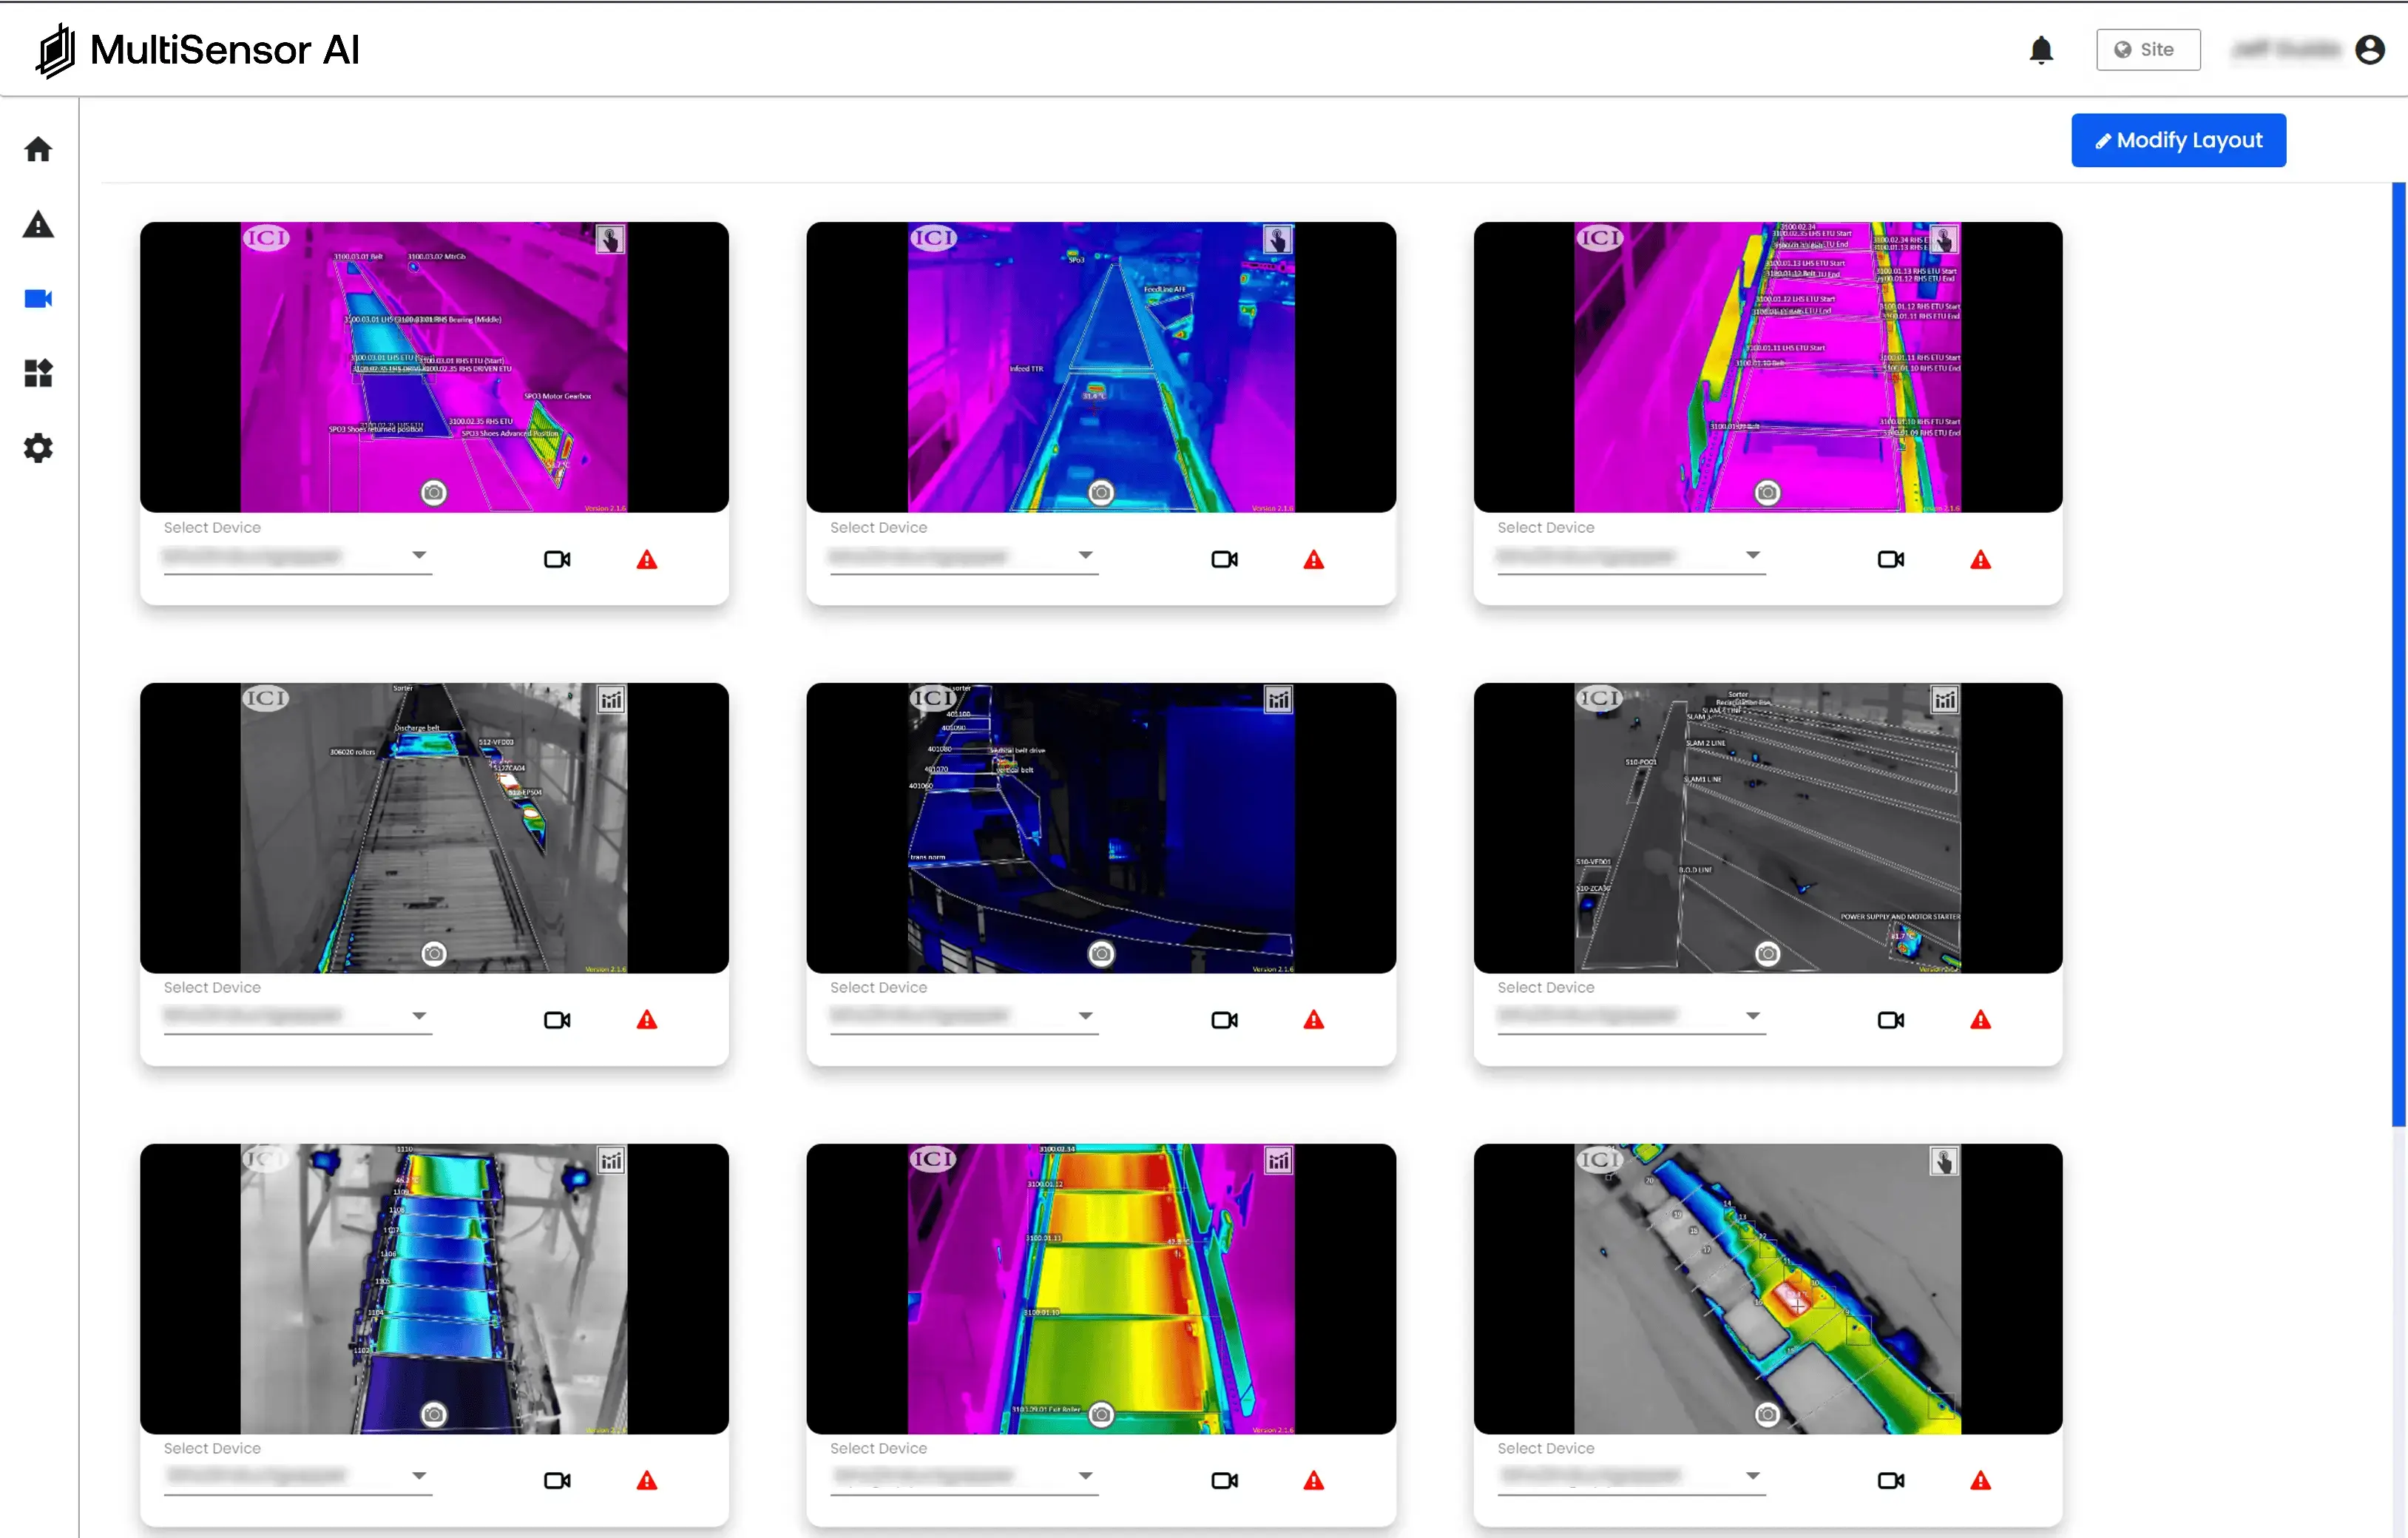
Fixed thermal sensors change the unit of measurement from an image to a trend.
Instead of a technician capturing a sorter drive four times a year, the asset is measured continuously. The question stops being "was it hot when we looked" and becomes "is it getting hotter than it was last week." That shift is what makes early degradation detection possible, because most failures announce themselves as a slope rather than a spike. For a deeper look at how that detection window compounds over time, see our Reliability Maturity Blueprint.
Thermal alone still has limits, which is why corroboration matters. A motor running warm could be a failing bearing, a cooling restriction, or simply a heavier duty cycle. Thermal data read alongside visual and vibration data separates those cases, and that separation is what keeps alerts credible. A monitoring system that cries wolf gets ignored, and an ignored system protects nothing. The same logic applies outside industrial facilities, too. Solar performance monitoring relies on the same shift from periodic inspection to continuous trending.
MSAI Connect is the multi-sensor condition intelligence layer that does this correlation. It sits above existing CMMS, BMS, DCIM, and SCADA systems rather than replacing any of them, and it can push work orders into the CMMS a team already uses. Detection is continuous, alerts are calibrated by reliability experts against each site's baseline, and the intervention stays with the maintenance team. On the hardware side, the MSAI Hub handles that continuous sensing at the edge, ingesting and processing signal locally before it reaches MSAI Connect.
The outcome is a longer detection window. Enough time to move a repair from an emergency call-out into planned downtime, which is where the cost difference actually lives.
See how MSAI Connect works · Request a demo
Frequently asked questions
How often should thermal imaging inspections be done?
Common practice is annual for electrical infrastructure and quarterly or monthly for rotating equipment, and the right interval depends on how fast the asset degrades. The practical test is whether your inspection interval is shorter than the failure progression of the asset you are inspecting. For a sorter drive or a UPS connection that can move from early degradation to failure inside two weeks, a quarterly route will miss most of what develops.
What is the difference between thermal imaging and continuous thermal monitoring?
Thermal imaging is typically a handheld inspection performed on a schedule, producing a snapshot under whatever conditions exist at that moment. Continuous thermal monitoring uses fixed sensors to measure the same assets constantly, producing a trend line. The instrument is similar; the coverage is not.
What are the limitations of thermal imaging?
Four main ones. It only sees conditions present at the moment of capture. It requires the asset to be under representative load to show a load-dependent fault. Some assets are unsafe or impractical to reach with a handheld camera. And a single reading carries far less diagnostic value than a trend across time. Thermal imaging also cannot distinguish between causes of heat on its own, which is why it is often paired with vibration data.
Can thermal imaging detect a failing bearing?
Often, yes. Bearing wear, misalignment, and lubrication failure all generate friction heat, and a bearing running hotter than identical bearings on the same line is a reliable early indicator. Vibration data confirms the diagnosis and typically detects the fault earlier in its progression.
Does continuous monitoring replace a BMS, DCIM, or CMMS?
No. It operates above those systems. A BMS or DCIM reports the state of infrastructure it controls, and a CMMS manages maintenance execution. A condition intelligence layer correlates sensor data to surface degradation earlier, then feeds that finding into the CMMS workflow a team already uses.
Keep reading

Thermal Monitoring Condition Monitoring Blog
How We Taught Solar Monitoring to Stop Mistaking Reflection for a Fault

Condition Monitoring Reliability Engineering Blog